Issue #20: What Hospitals Actually Get Paid
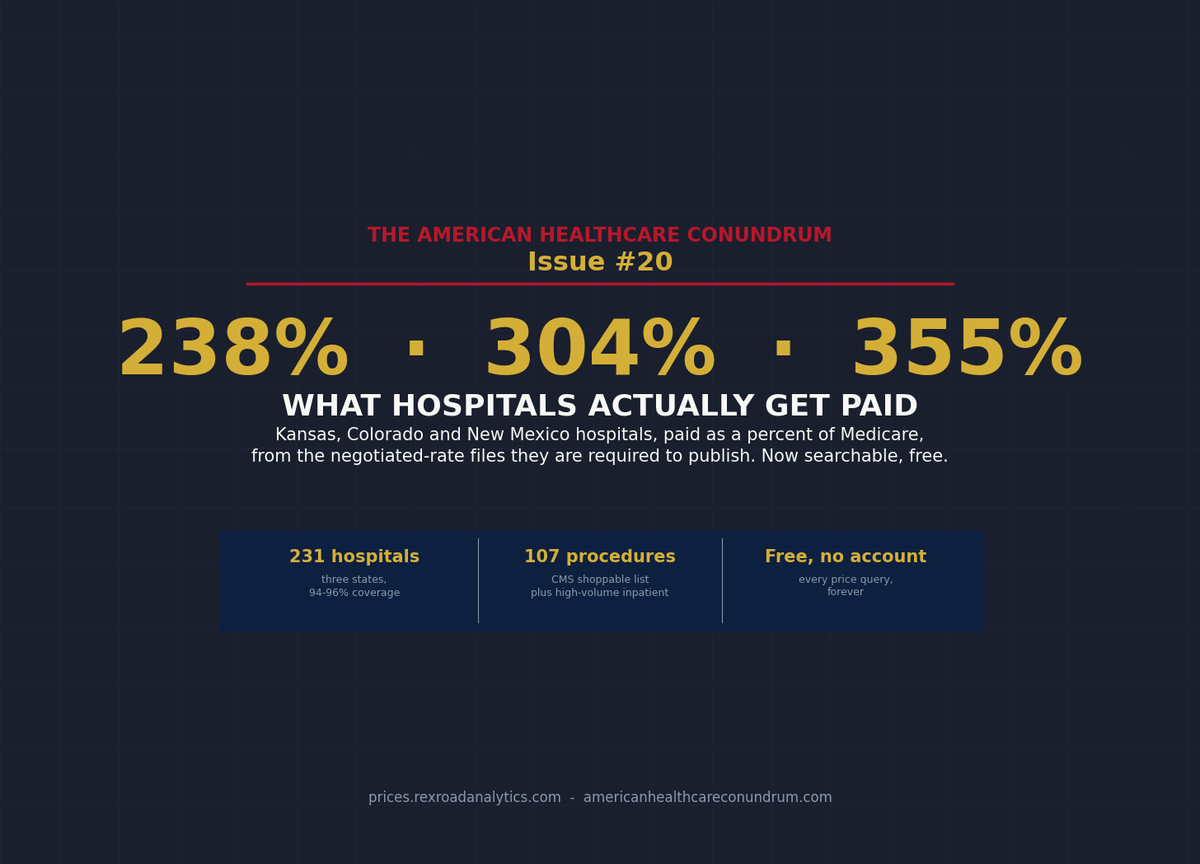
Kansas 238%, Colorado 304%, New Mexico 355% of Medicare. Every hospital's negotiated rates, from the files they are required to publish, now free and searchable.
Each issue of The American Healthcare Conundrum identifies one fixable problem in U.S. healthcare spending, builds the data case, and recommends a specific policy fix. All analysis uses publicly available data. Methodology is published.
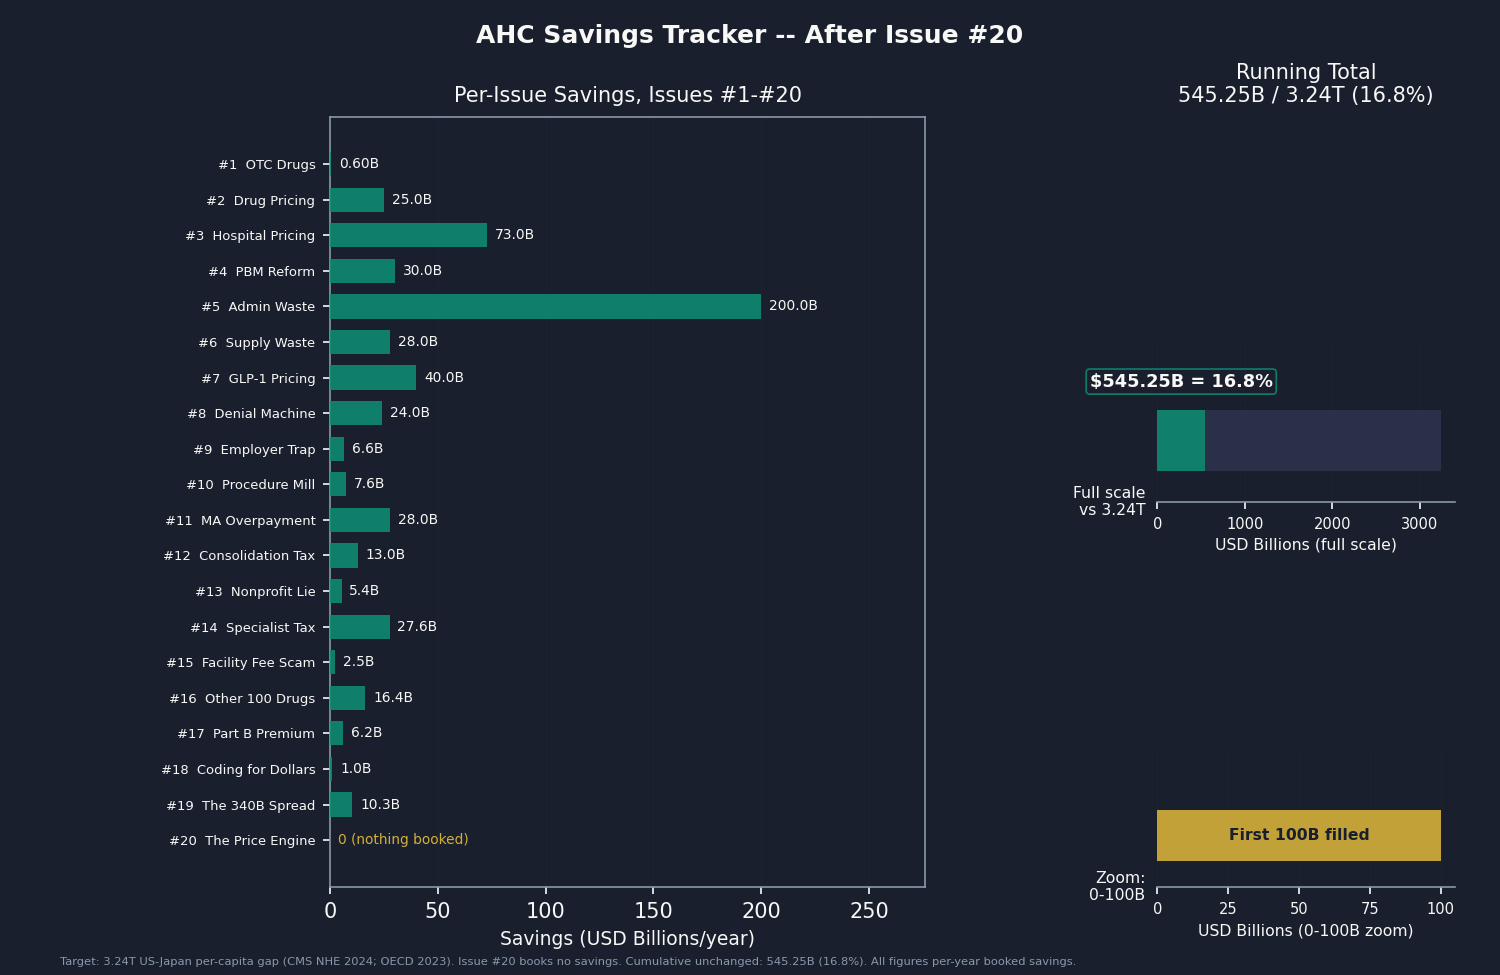
Target: ~$3.24T US-Japan per-capita spending gap
(Japan: highest life expectancy, lowest infant
 mortality in OECD, ~half US per-capita spend)

Full scale: $0 ─────────────────────────── $3.24T
            █████░░░░░░░░░░░░░░░░░░░░░░░░  16.8%
            ↑ $545.25B identified

Per-issue savings (1 block ≈ $8B; max bar = $200B):
 #1 ▏                          $0.6B   OTC Drug Overspending
 #2 ███                       $25.0B   Drug Pricing
 #3 █████████                 $73.0B   Hospital Pricing
 #4 ████                      $30.0B   PBM Reform
 #5 █████████████████████████ $200.0B  Admin Waste
 #6 ███                       $28.0B   Supply Waste
 #7 █████                     $40.0B   GLP-1 Pricing
 #8 ███                       $24.0B   Denial Machine
 #9 █                          $6.6B   Employer Trap
#10 █                          $7.6B   Procedure Mill
#11 ████                      $28.0B   MA Overpayment
#12 ██                        $13.0B   Consolidation Tax
#13 █                          $5.4B   Nonprofit Lie
#14 ████                      $27.6B   Specialist Tax
#15 ▏                          $2.6B   Facility Fee Scam
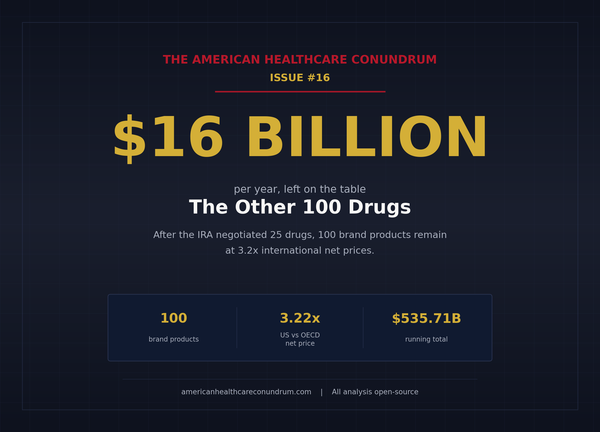
#16 ██                        $16.4B   The Other 100 Drugs
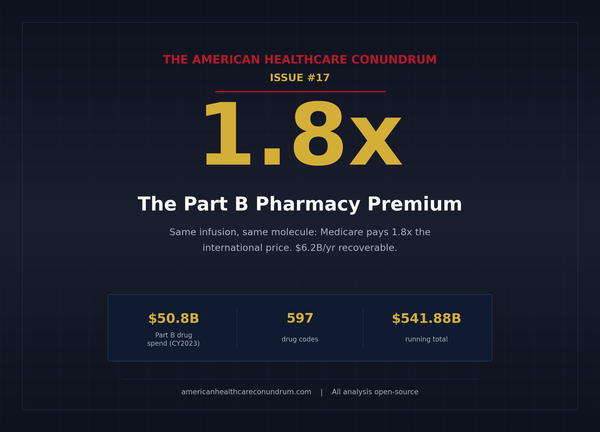
#17 █                          $6.2B   Part B Pharmacy Premium
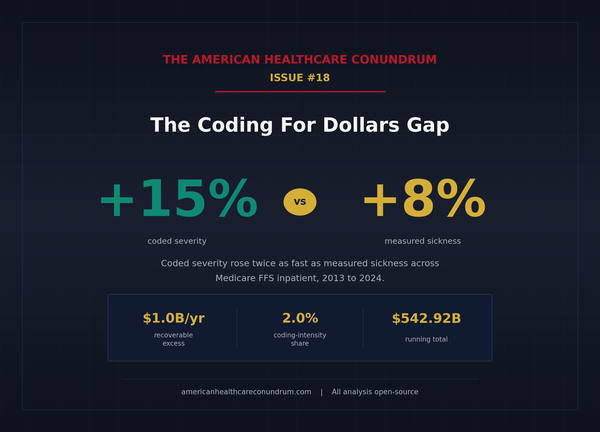
#18 ▏                          $1.0B   Coding for Dollars
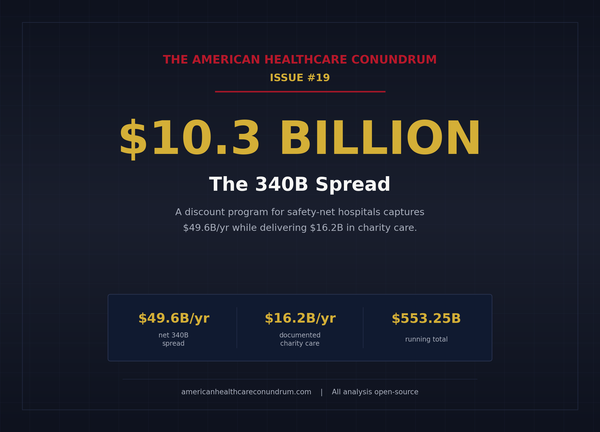
#19 █                         $10.3B   The 340B Spread
#20                            $0.0B   The Price Engine
   ──────────────────────────────────────────────────
   Total: $545.25B  ·  $2,694.75B remaining
   Scale: $3.24T (CMS NHE 2024; Japan OECD 2023)
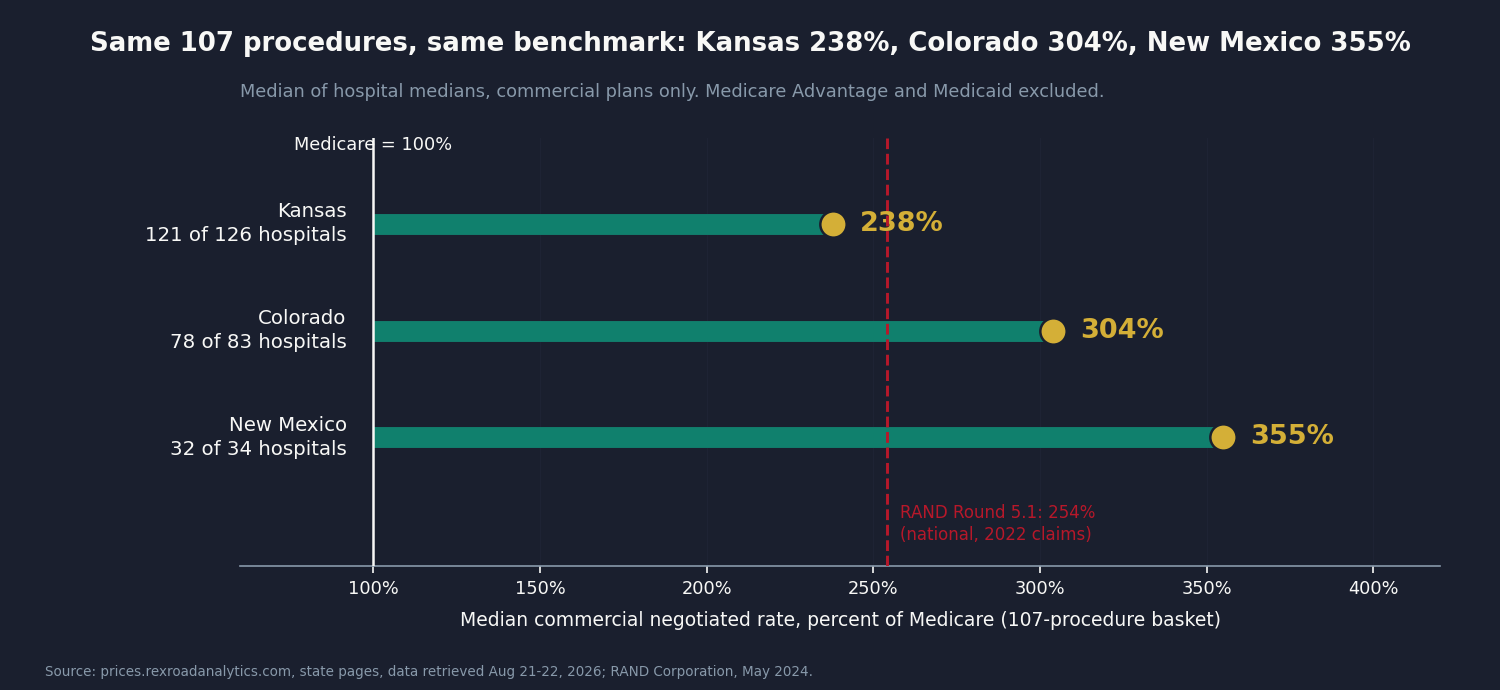
In Kansas, the median hospital is paid 238 percent of what Medicare pays, by commercial insurers, for the same care. In Colorado, 304 percent. In New Mexico, 355 percent.
Those three numbers come from the hospitals' own negotiated-rate files, the ones every hospital has been federally required to publish since 2021 (45 CFR 180.50). We spent the summer building a tool that reads them. It is live today, free, and needs no account: prices.rexroadanalytics.com.
This issue is short. It shows you what the tool says, and asks you to use it.
What Hospitals Actually Get Paid
The engine reads each hospital's machine-readable price file, keeps the commercial negotiated rates for a fixed basket of 107 procedures (the Centers for Medicare and Medicaid Services (CMS) shoppable-services list plus high-volume inpatient care), and divides each rate by what Medicare pays that same hospital for that same procedure (prices.rexroadanalytics.com, Methodology). Medicare Advantage and Medicaid rates are excluded. The result is one unit, percent of Medicare, that makes a knee replacement in Wichita comparable to one in Santa Fe.
Three states are live: Colorado, New Mexico, and Kansas. Together, 231 hospitals and 14,742 priced hospital-by-procedure cells, from files retrieved August 21 and 22, 2026 (prices.rexroadanalytics.com, state pages).
Three States, One Benchmark
Kansas 238 percent. Colorado 304. New Mexico 355 (prices.rexroadanalytics.com, state pages, August 2026). Same procedures, same Medicare denominator. A hospital in New Mexico is paid, per Medicare dollar, roughly half again what a hospital in Kansas is paid for the same list of care.
For reference, Issue #3: The 254% Problem built its case on RAND's national finding that private plans paid 254 percent of Medicare on 2022 claims (RAND Corporation, May 2024). The engine measures 2026 negotiated rates rather than paid claims, so its figures run higher; the ranking across states is the point.
The Spread Inside Each State
State medians hide the range, and the range is what matters to anyone with a deductible.
A Level 4 emergency department visit, the facility charge examined in Issue #15: The Facility Fee Scam, is priced by 62 Colorado hospitals, from $387 at Sedgwick County Memorial Hospital to $6,518 at St. Francis Hospital, Interquest in Colorado Springs. Seventeen times, for one billing code, in one state (prices.rexroadanalytics.com, Colorado findings).
A brain MRI with and without contrast is priced by 75 Kansas hospitals at anywhere from $296 to $5,262 (prices.rexroadanalytics.com, Kansas findings). A complete echocardiogram in New Mexico runs from $558 at CHRISTUS Southern New Mexico to $7,809 at Alta Vista Regional Hospital in Las Vegas, New Mexico (prices.rexroadanalytics.com, New Mexico findings).
The spread persists inside a single building. At Sky Ridge Medical Center in Lone Tree, Colorado, a four-view lower back X-ray is $215 for Anthem Blue Cross Blue Shield members and $2,700 for Cigna members (prices.rexroadanalytics.com, Colorado findings). At Menorah Medical Center in Overland Park, Kansas, a CT of the pelvis with contrast is $243 for Cigna and $3,611 for Anthem (prices.rexroadanalytics.com, Kansas findings). Which carrier gets the good rate is a property of the contract, not the carrier.
By Who Is Paying
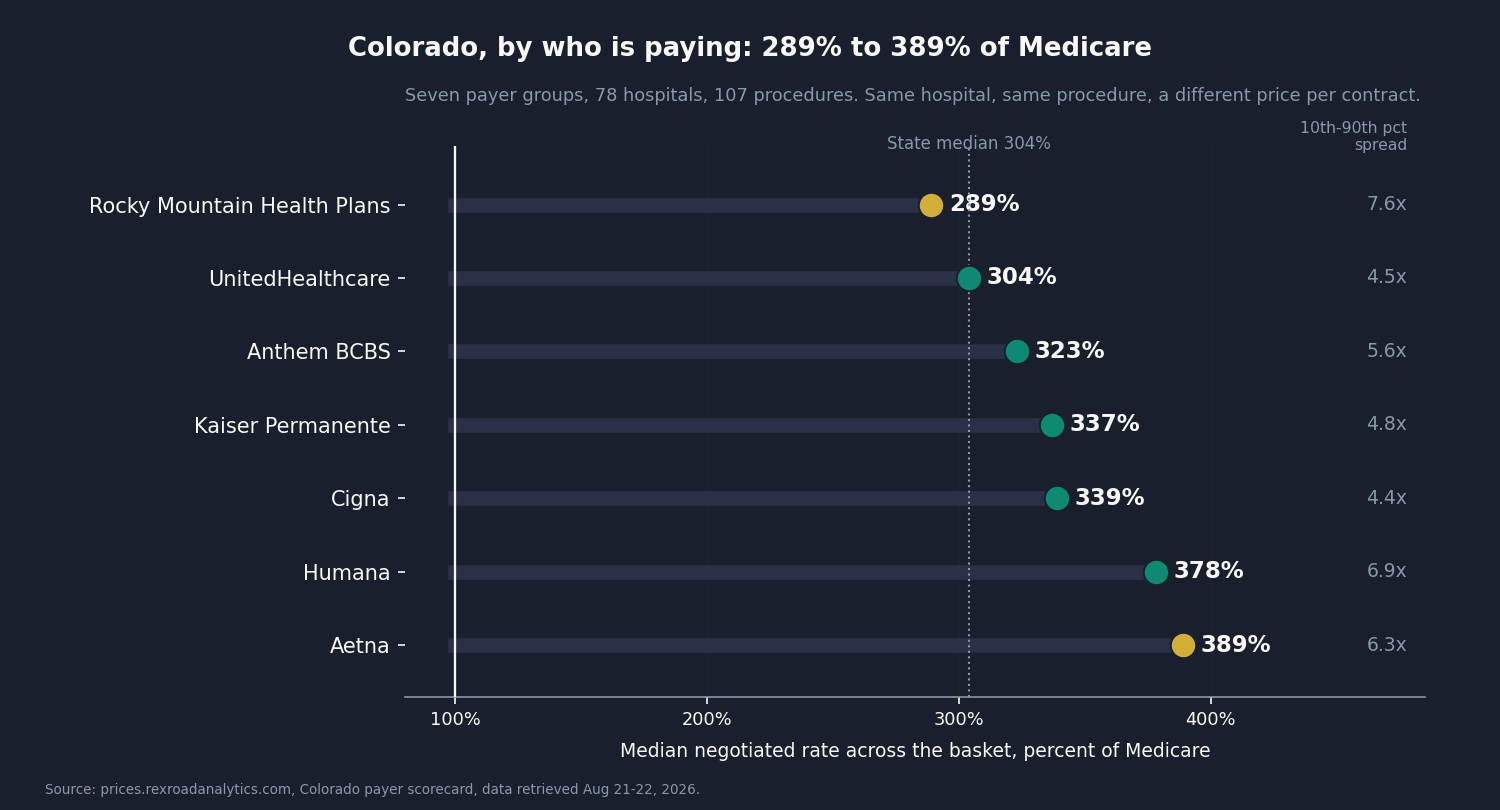
Across Colorado, the median rate a carrier has negotiated ranges from 289 percent of Medicare for Rocky Mountain Health Plans to 389 percent for Aetna, with UnitedHealthcare at 304, Anthem at 323, Kaiser at 337, Cigna at 339, and Humana at 378 (prices.rexroadanalytics.com, Colorado payer scorecard). The 100-point gap between the best and worst negotiator in one state is larger than the gap between Kansas and Colorado. For an employer, that gap is the premium described in Issue #9: The Employer Trap, now visible hospital by hospital.
Price Against Cost
Every hospital files a cost report with CMS, the same Healthcare Cost Report Information System (HCRIS) filings behind Issue #5: The Paper Chase and Issue #13: The Nonprofit Lie, which yields a rough estimate of what a procedure costs the hospital to deliver. With that caveat attached, HCA HealthONE's six Denver-area hospitals are paid 7.3 times their estimated cost across the basket, against 3.6 for Intermountain and 3.2 for UCHealth and CommonSpirit (prices.rexroadanalytics.com, Colorado findings). The system-level pattern is the one Issue #12: The Consolidation Tax described; this is what it looks like at the procedure level. Every hospital page on the site carries its own figure.
How to Use It
Search a procedure, a hospital, or an insurer. Every state has one explorer: compare by hospital, procedure, insurer, system, or region, measured in percent of Medicare, dollars, or multiple of estimated cost. Every hospital has its own page with its rates by carrier and its rank in the state. Every view is a link you can send to someone. Everything a person can ask on a screen is free, without an account, and will stay that way.
Three good places to start:
- Colorado explorer: every hospital in the state ranked against Medicare.
- Colorado payer scorecard: which carrier negotiates what, and where.
- Methodology: how every number is built, and what it is not.
Where It Goes
Three states is a start. Forty-seven remain, and a growing set of them have written hospital price limits in this exact unit: New Mexico caps its state-employee plan at 200 percent of Medicare in its larger counties, in force since July 2025; Washington's 200 percent cap on public-employee plans takes effect January 2027; Indiana, Vermont, Oregon, and Montana have their own versions (Commonwealth Fund, 2026). Issue #3 recommended exactly this kind of reference price. A cap with no procedure-level monitor is a press release. This engine is the monitor, and it already runs in one cap state.
The pipeline that built three states can build the rest. What it needs is what a Mac in Denver cannot supply alone: compute for the largest states, a quarterly refresh cadence, and the quality work that keeps every number traceable. We are looking for foundations, research partners, purchaser coalitions, newsrooms, and state fiscal offices who want this to exist for their state and are willing to help fund it. If that is you, or you know who it should be, reach us at contact@ahcdata.fund or ahcdata.fund.
What We Need From You
Use it. Find your hospital. If you have an explanation of benefits or a bill in a drawer, compare it. If a price looks wrong, reply to this email and say which one; a reader who knows the building catches things faster than any parser.
Tell us which state next. The order is driven by where someone is waiting. There is an "Ask for a state" button on the site, or reply to this email. A sentence about why is worth more than a vote.
Tell us what you would do with the data. Researchers, benefits managers, reporters, and state fiscal staff have asked for the whole table. Name the question you would put to it, and it shapes what ships next.
Forward this to one person who negotiates with a hospital. A benefits director, a union trust administrator, a broker, a county commissioner with a hospital on the budget. The people who can use this are mostly not on this list yet.
What's Next
The engine is the work now. When the data says something worth an issue, there will be an issue.
The engine's methodology is published at prices.rexroadanalytics.com/methodology. The analysis behind this newsletter is at github.com/rexrodeo/american-healthcare-conundrum. If the math looks wrong, say so.
If this issue was useful, forward it to someone who pays for hospital care, which is most of us eventually.
[Subscribe to The American Healthcare Conundrum]
Sources: 45 CFR Part 180 (Hospital Price Transparency; Section 180.50; ecfr.gov); prices.rexroadanalytics.com, Colorado, New Mexico, and Kansas state pages, findings pages, Colorado payer scorecard, and methodology (data retrieved August 21-22, 2026); RAND Corporation, "Prices Paid to Hospitals by Private Health Plans," Round 5.1, May 2024 (254% of Medicare, 2022 claims; rand.org); CMS Medicare Inpatient Hospitals by Provider and Service, 2024 (DRG benchmarks; data.cms.gov); CMS July 2026 OPPS Addendum B and FY2026 IPPS final rule impact file (outpatient benchmarks, wage indices, cost-to-charge ratios); CMS 2026 Clinical Laboratory Fee Schedule; CMS Healthcare Cost Report Information System (HCRIS) HOSP10 (cost-to-charge ratios); Commonwealth Fund, "Affordability Concerns Are Driving States To Curb Hospital Prices," 2026 (NM SB376 200%/175% state-employee cap, counties over 125,000, effective July 1, 2025; WA SB5083 200% PEBB/SEBB cap effective January 1, 2027; IN HB1004 2025; VT commercial cap by 2027; OR and MT precedents).
Running total after Issue #20: $545.25B / $3.24T (16.8%). This issue books no savings.
Methodology footnotes: No savings are booked in this issue; the running total is unchanged from Issue #19. Percent-of-Medicare figures are computed by prices.rexroadanalytics.com: for each hospital and each of 107 procedures, the median commercial negotiated rate across published plans, divided by the hospital's Medicare benchmark (inpatient: the hospital's own 2024 average Medicare payment per DRG from CMS claims data; outpatient: July 2026 OPPS Addendum B national rate, wage-adjusted with FY2026 wage indices; laboratory: 2026 Clinical Laboratory Fee Schedule). Medicare Advantage, Medicaid, and workers' compensation rates are excluded. Cells whose commercial median falls below 60 percent of the Medicare benchmark are flagged as implausible and excluded from summary statistics. State medians are medians of hospital medians. Cost multiples use hospital-wide cost-to-charge ratios from HCRIS and are estimates. Denominator: $3.24T US-Japan per-capita spending gap (CMS NHE 2024 final; OECD Health at a Glance 2025). Full methodology is at prices.rexroadanalytics.com/methodology.
The American Healthcare Conundrum publishes when the data is ready. All analysis uses publicly available data. Methodology is published. Figures are validated before publication.
Get every issue in your inbox
The American Healthcare Conundrum is free. One fixable problem in U.S. healthcare, with the data, every week.