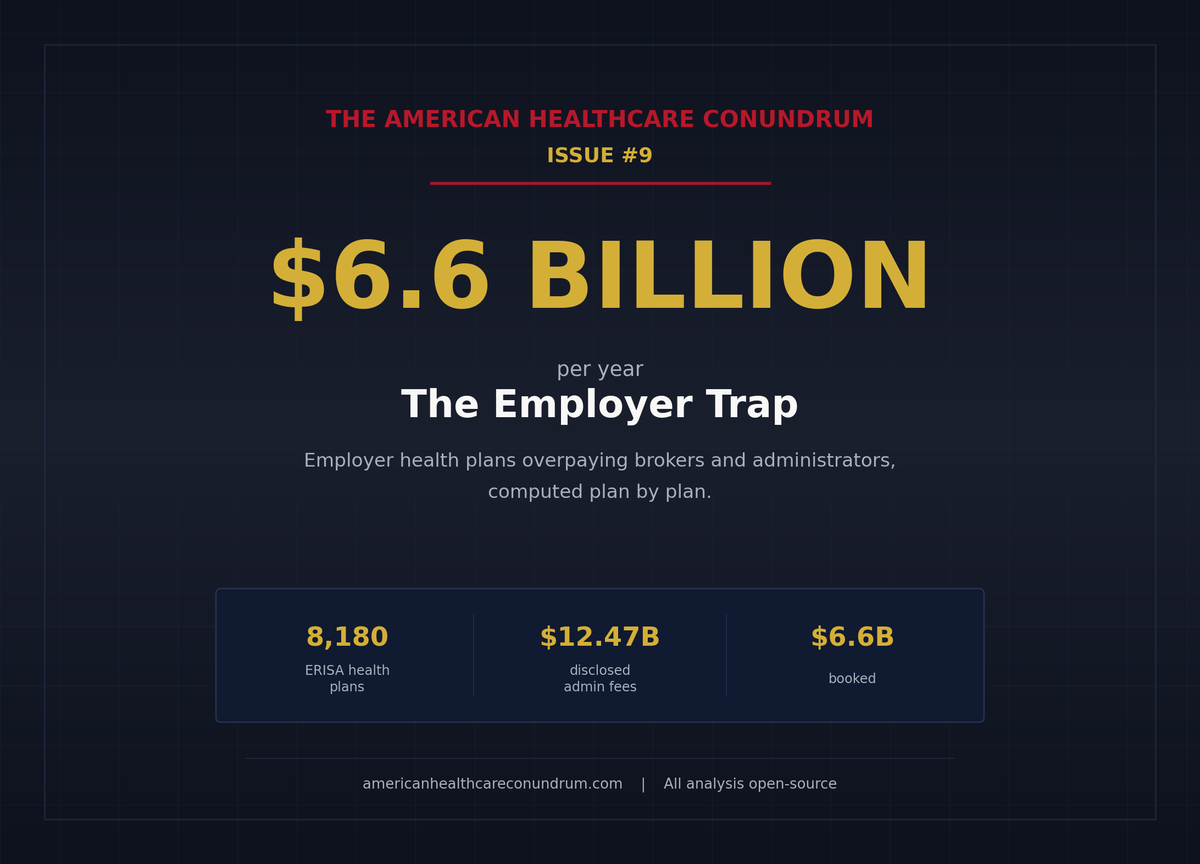
Issue #9: The Employer Trap
How 32 years of premium growth moved $125,340 in wages through ERISA plans into the hospital-PBM-insurer stack, and what Form 5500 finally lets us measure
Each issue of The American Healthcare Conundrum identifies one fixable problem in U.S. healthcare spending, builds the data case, and recommends a specific policy fix. All analysis uses publicly available data. Code is open-source.
Target: ~$3.24T US-Japan per-capita spending gap
(Japan: highest life expectancy, lowest infant
 mortality in OECD, ~half US per-capita spend)

Full scale: $0 ───────────────────────── $3.24T
            ███░░░░░░░░░░░░░░░░░░░░░░  13.4%
            ↑ $435.2B identified

Per-issue savings (1 block ≈ $8B; max bar = $200B):
 #1 ▏                          $0.6B   OTC Drug Overspending
 #2 ███                       $25.0B   Drug Pricing
 #3 █████████                 $73.0B   Hospital Pricing
 #4 ████                      $30.0B   PBM Reform
 #5 █████████████████████████ $200.0B  Admin Waste
 #6 ███                       $28.0B   Supply Waste
 #7 █████                     $40.0B   GLP-1 Pricing
 #8 ████                      $32.0B   Denial Machine
 #9 █                          $6.6B   Employer Trap (this issue)
   ────────────────────────────────────────────────
   Total: $435.2B  ·  $2,804.8B remaining
   Scale: $3.24T (CMS NHE 2024; Japan OECD 2023)
A note on the new denominator. CMS released its 2024 National Health Expenditure final data on April 18, 2026. US per-capita health spending rose from $14,570 to $15,474. The US-Japan per-capita gap widened from approximately $3.0 trillion to $3.24 trillion. Issue #9 is the first issue to fill against the revised $3.24T. Issues #1 to #8 were published using the prior $3T denominator and are not retrofitted; the running totals shown in those archived issues stay as shipped. The same $435.2B running total represents 14.5 percent of $3T or 13.4 percent of $3.24T. The size of the problem has not actually grown; the measuring stick was sharpened.
The Employer Trap
In 1988, premiums for employer-sponsored health insurance consumed 7.9 percent of total compensation for the typical American family. By 2019, the share had reached 17.7 percent. The families never saw the difference. It came out of wages that did not rise (Hager K, Emanuel EJ, Mozaffarian D, JAMA Network Open, January 16, 2024).
The squeeze is sharper at the bottom of the income distribution. At the 20th earnings percentile, premiums consumed 28.5 percent of total compensation in 2019. For Hispanic families, 19.8 percent. The deductible goes up every year. The wage barely follows.
The mechanism is well documented. When premiums rise, employers absorb the cost not by accepting thinner margins but by holding wages flat. Twenty years of labor-economics research, starting with Baicker and Chandra in 2006, finds the wage offset to be roughly dollar-for-dollar over time. Over the past decade, employer-sponsored premiums grew about 47 percent (KFF EHBS 2024). Total compensation grew about 30 percent (BLS ECEC). The gap is not luck. It is plumbing.
The line item the worker sees is "health insurance." What the worker is actually paying is whatever the hospital-PBM-insurer stack charged the employer that year. So who chooses that stack? Who picks the brokers, the third-party administrators, the consultants that sit between the worker and the care? That is the question Issue #9 examines.
We went looking for fiduciary failure at the employer. What we found was more specific, and more boring than the standard "employers are bad at buying health benefits" story. Some are. Most are not. The variance is the story.
[Subscribe to The American Healthcare Conundrum]
The Invisible Payer
The US employer-sponsored insurance system covers 136 million participants and beneficiaries (DOL EBSA Report to Congress, 2025 edition, citing 2022 Form 5500 filings). About 65 percent of covered workers at firms offering health benefits are in self-insured plans, where the employer bears the financial risk of claims directly (KFF EHBS 2024, Figure 10.2). The other 35 percent are in fully insured plans, where the employer buys a policy and the carrier bears the risk.
The 65-35 split matters because the rules are different. Self-insured ERISA plans have no regulatory ceiling on the prices they pay for hospital services, drugs, or plan administration. They pay whatever the hospital-PBM-insurer stack charges. They are not subject to state insurance regulation. They are subject to ERISA, which requires plan fiduciaries to act prudently. But ERISA does not tell them what "prudent" means when it comes to health plan administration fees, and for 50 years, nobody required them to disclose what they were paying.
The broker sits in the middle of this structure. Most employers with 50 or more employees purchase health benefits through a broker who earns a commission from the insurance carrier for placing the account. The commission is paid by the carrier, not by the employer. That structural detail matters: a broker whose fee increases when the client pays more in premium has a financial incentive to place clients in higher-premium plans, not lower-premium ones. A 2019 ProPublica investigation by Marshall Allen documented the mechanism precisely: carrier commissions typically run 3 to 6 percent of the total premium, meaning a broker earns roughly $50,000 per year on a 100-person company paying average premiums, and that fee rises every time the premium goes up (Allen M, ProPublica, February 20, 2019).
The Consolidated Appropriations Act of 2021 (CAA) changed this with a single provision: ERISA Section 408(b)(2)(B), effective December 27, 2021, now requires brokers and consultants to disclose to plan fiduciaries all direct and indirect compensation above $1,000. For the first time, an employer can see what their broker is earning from the carrier. The CAA also requires that fiduciaries use this information. Hospital price transparency compliance, a related disclosure requirement, reached 36 percent of hospitals as of the PatientRightsAdvocate July 2025 report. The disclosure infrastructure is being built. The question is whether it is being used.
That is the fiduciary question. And it turns out there is a way to test it from public data.
The Case That Almost Worked
Last November, a federal judge in New Jersey threw out a lawsuit that, if it had succeeded, would have answered the central question of this issue.
The plaintiffs were Johnson and Johnson employees. They alleged that J&J had overpaid its pharmacy benefit manager (Express Scripts), that the overpayment was a breach of ERISA fiduciary duty, and that participants paid the price in higher contributions and prescription costs. Lewandowski v. Johnson and Johnson, No. 3:24-cv-00671 (D.N.J. Nov. 26, 2025).
The judge dismissed the case. Not because the alleged overpayment was implausible. Because the plaintiffs could not show, at the individual-dollar level, that the overpayment had cost them anything specific.
Here is the operative line: "Put simply, it is too speculative that the allegedly excessive fees the Plan paid to its PBM had any effect at all on Plaintiffs' contribution rates and out-of-pocket costs for prescriptions."
A nearly identical case against Wells Fargo was thrown out four months earlier on the same logic. Navarro v. Wells Fargo, 2025 WL 897717 (D. Minn. Mar. 24, 2025). Too many moving parts in plan economics for a court to isolate the individual harm from the structural one.
Read the two opinions together and they say the same thing in slightly different words: if a plaintiff could point to a public benchmark for what a reasonable plan fee looks like, the standing problem might be solvable. Right now, no such benchmark exists for health welfare plans. The courts said it. We checked.
The rest of this issue builds the first version of one.
What Schedule C Is
Form 5500 Schedule C is the federal disclosure that an ERISA plan files showing what it paid each of its outside service providers: consultants, third-party administrators, brokers, lawyers, actuaries.
Plan year 2023 is the first full year of post-CAA 2021 broker and consultant compensation disclosure in the health-plan context. We pulled every Schedule C filed by a 4A-coded health welfare plan from DOL's "Latest" research file. Our search of academic and policy literature did not turn up a prior plan-level public analysis of this file for health welfare plans, which is why we built one. If a prior analysis exists, we want the citation and we will update.
The sample at a glance:
- 8,180 plans
- 23.8 million participants
- $12.47 billion in disclosed service-provider compensation
The Bias Caveat, Up Front
Schedule C is filed primarily by large, trust-funded plans, so the sample skews. One cell (jumbo plans with mixed funding, 260 plans) accounts for 65 percent of in-sample lives and half the disclosed fees. Inside that cell, roughly 26 plans drive 62 percent of the above-peer excess we measure.
This analysis does not describe American employers broadly. It describes how the largest, most sophisticated plan sponsors in the country structure their administration. Every plan in the jumbo-mixed cell is a verified 4A health welfare plan; none is a misclassified pension filing. Excluding the cell entirely would drop the booked Component C from $1.68 billion to $0.87 billion and the headline from $6.6B to $5.8B. The findings are real. The scope is specific.
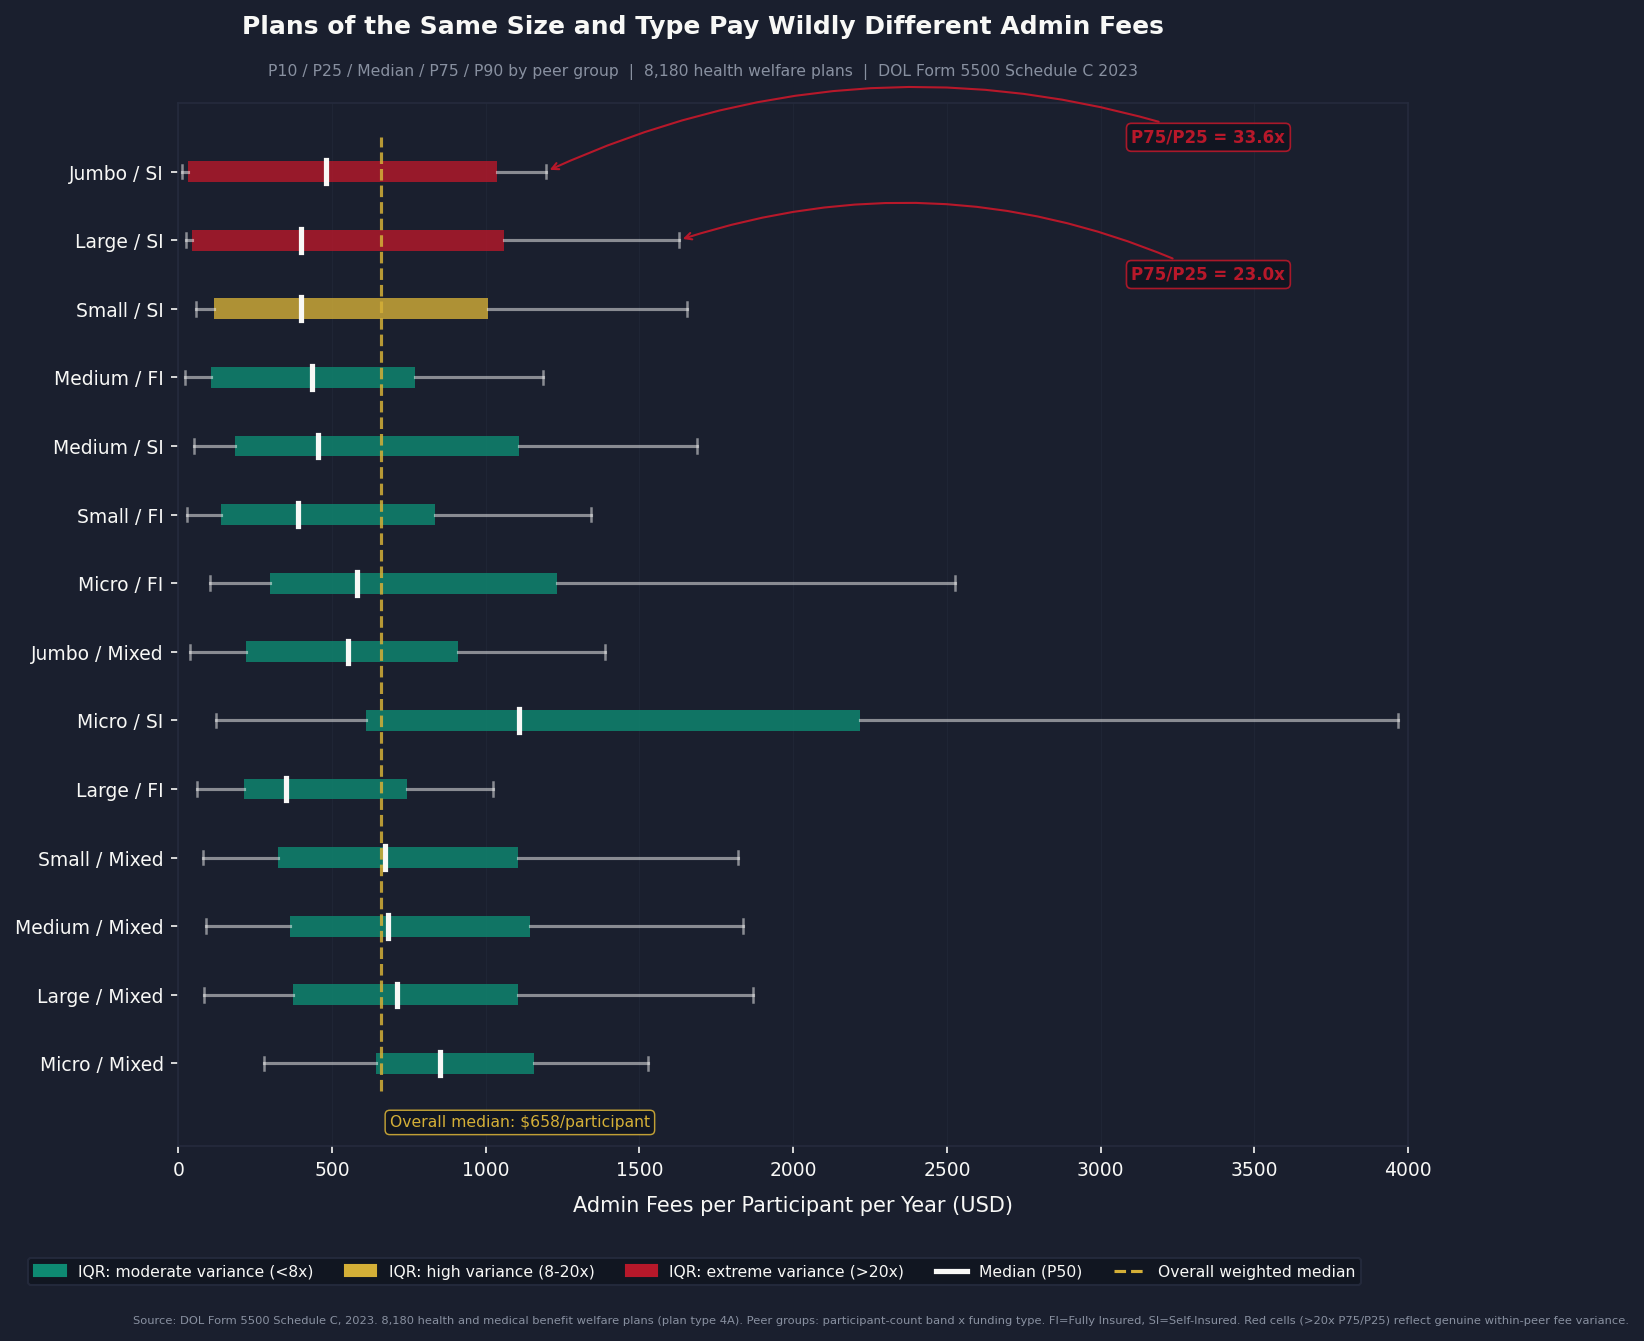
What the Variance Looks Like
Inside peer groups defined by participant-count band and funding type, the spread in admin fees per participant is not noise.
At the high end of the jumbo self-insured cell, the plan at the 75th percentile pays 33 times what the plan at the 25th percentile pays for the same category of services.
Across all peer groups combined, plans paying above their peer-group P50 contribute $5.6 billion in gross above-median admin fees: money disclosed on federal filings, paid above what similarly situated plans paid for similar services.
That $5.6 billion is not what we book. Schedule C does not list services line-by-line, and plans at the high end may genuinely buy more: deeper compliance support, more carve-out management, more actuarial work. So we apply a 30 percent reducibility factor: we treat only three dollars of every ten of above-median excess as recoverable. Component C books at $1.68 billion per year.
The 30 percent floor is conservative. After Tibble v. Edison and the wave of 401(k) fiduciary cases, retirement plan administrative fees compressed by 20 to 30 percent over five years. Ohio's Medicaid PBM spread pricing reform compressed by 12 to 18 percent in year one. We are not forecasting better than that.
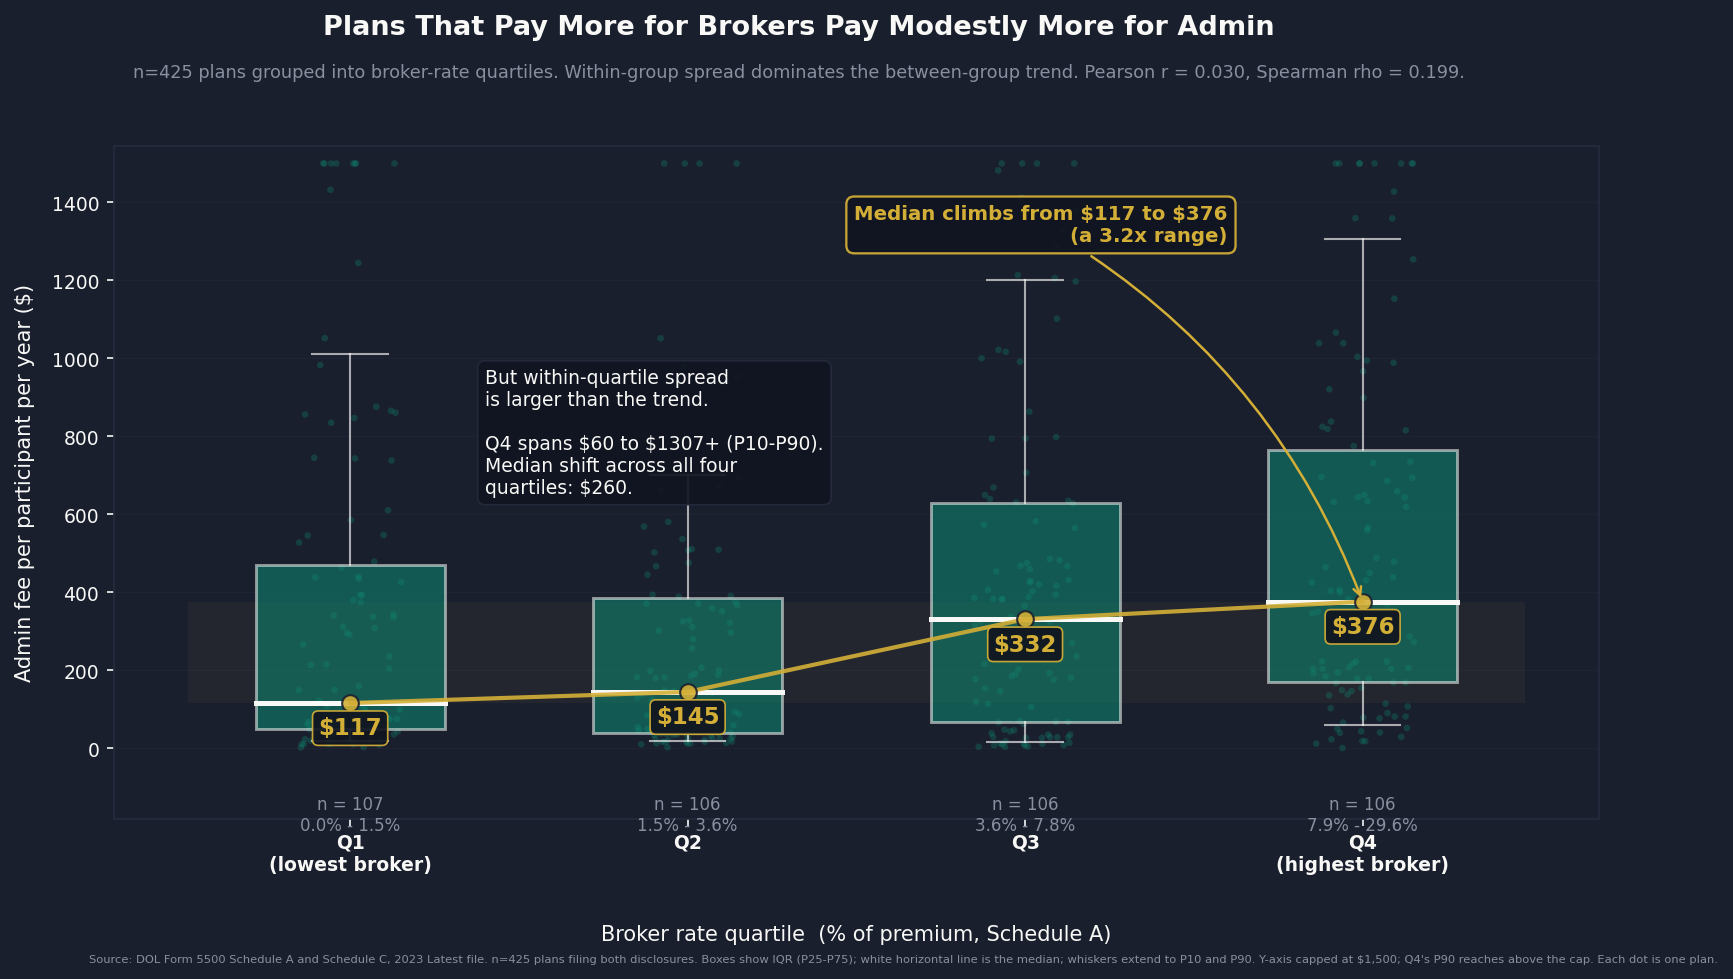
How Connected Are the Two Bills?
When we matched the 425 plans that filed both a Schedule A (broker commissions) and a Schedule C (admin fees), the link between the two was real but weak.
- Pearson r = 0.030 (linear correlation)
- Spearman rho = 0.199 (rank correlation, p ≈ 0.00004)
Plans that overpay their broker do pay a bit more for their administrator too, on average. But only a bit. If you know what a plan paid its broker, you still cannot guess what it paid its administrator. Most admin overpayment has nothing to do with broker overpayment.
That matters for two reasons. First, brokers and administrators are separate markets, so they need separate fixes. Second, the broker savings and the admin savings come from different sources, so we add them without counting the same dollar twice.
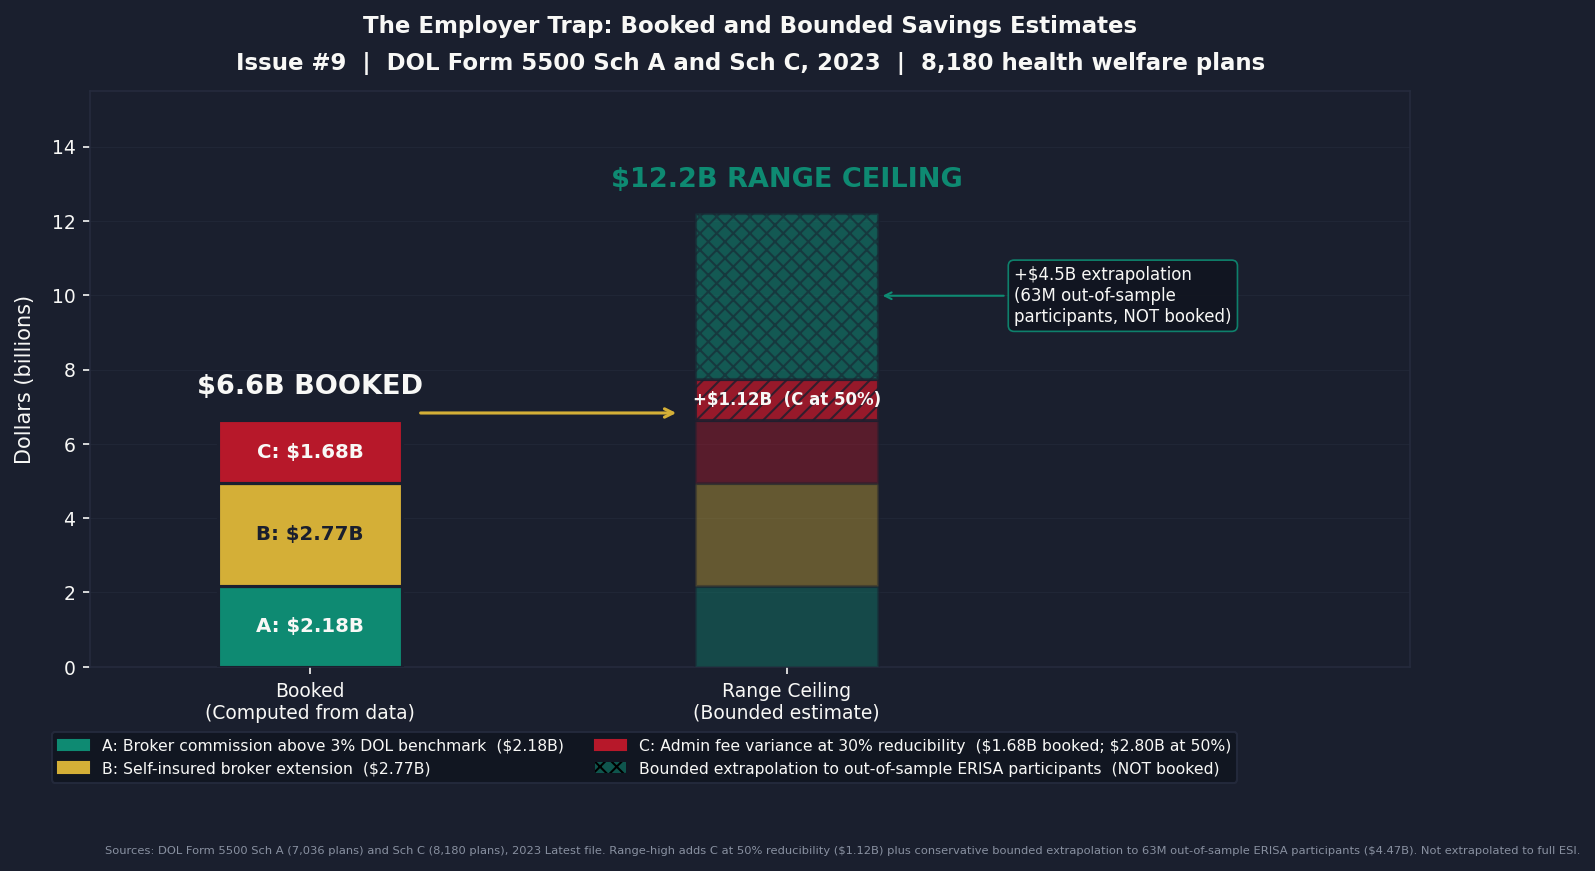
Consolidated Estimate
Three components, each computed from federal filings:
- Component A ($2.18B): per-plan broker commission above the 3 percent DOL benchmark, 7,036 fully insured plans (Schedule A)
- Component B ($2.77B): Schedule A broker rate ($82.68 per life) extended at a conservative 0.5 ratio to approximately 115 million employer-sponsored self-insured lives (KFF EHBS 2024)
- Component C ($1.68B): above-peer-median admin fees, 8,180 plan Schedule C sample at 30 percent reducibility
Booked total: $6.6 billion per year. Range: $6.6B to $12.2B.
The range-low equals the booked figure because 30 percent reducibility is our conservative floor, not our midpoint. The range-high reflects a 50 percent reducibility assumption on Component C plus a bounded extrapolation to plans that file Form 5500 but not Schedule C, which we describe (but do not book) in the box below.
What the public data cannot tell us
The $6.6B booked figure rests on the 8,180 plans that file Schedule C. The full ERISA health welfare population is roughly 87 million participants. About 63 million of those are in plans that file a Form 5500 but skip Schedule C. We do not know whether the variance rate we measure in-sample generalizes to that larger population, contracts, or expands. Public data alone cannot answer it.
Anyone with licensed access to claims-level data (Truven/MarketScan, Optum Clinformatics, IQVIA Pharmetrics, Definitive Healthcare) or an active DUA for CMS LDS/VRDC, a state APCD, or AHRQ HCUP can. If that is you, we want to talk.
ahcdata.fund has the full methodology gap, the specific empirical question, and the co-publication terms. Email: contact@ahcdata.fund. Code stays open. Every contributing organization named.
Who Profits
The broker-consulting firms that sit between employers and insurance carriers collect compensation from both sides of the transaction. The employer pays a consulting fee. The carrier pays a commission. The plan participant pays in wages.
Who Profits: Marsh McLennan Companies (MMC), parent of Mercer FY2024 Revenue: $24.5B | Operating Margin: 23.7% | CEO Comp (John Q. Doyle): $22.8M | Stock Buybacks (2020-24): ~$4-6B | CEO-to-Median-Worker Ratio: 314:1 This issue's mechanism: Mercer, MMC's employee benefits consulting segment, generated $5.7 billion in FY2024 revenue (up 5 percent on an underlying basis), with the Health sub-segment a key growth driver (MMC 2024 10-K). Mercer routinely appears in the top-five disclosed service providers in large-plan Schedule C filings. The structure: Mercer charges the plan sponsor a consulting fee while also collecting indirect compensation from carriers in which it places business. CAA 2021 requires disclosure of this dual compensation; it does not prohibit it. Schedule C filings in our 8,180-plan sample show per-participant consulting fees that vary by as much as 33 times within the same peer group, and Mercer is among the largest named recipients in the jumbo-plan cell that accounts for 65 percent of sample lives.
Who Profits: Willis Towers Watson (WTW) FY2024 Revenue: $9.93B | Adjusted Operating Margin: ~23% | CEO Comp (Carl Hess): $12.5M | Stock Buybacks (since 2021): ~$5-6B This issue's mechanism: WTW's Health, Wealth and Career segment is its largest revenue division, and health and benefits consulting is the primary service line for ERISA plan-sponsor clients. WTW does not separately report Health and Benefits segment revenue in public filings (WTW 2024 10-K). The firm's growth strategy centers on expanding health and benefits advisory relationships with large self-insured employers. Under the commission-from-carrier model, WTW's compensation rises when premiums rise, a structural incentive that CAA 2021's disclosure rules expose but do not remove. The Navarro complaint against Wells Fargo named the employer's health-plan consultant structure as contributing to the alleged PBM fee excess.
Who Profits: Aon plc (AON) FY2024 Revenue: $15.7B | Operating Margin: 26.6% | CEO Comp (Gregory C. Case): $26.2M | CEO-to-Median-Worker Ratio: 306:1 This issue's mechanism: Aon's Health Solutions segment generated $3.3 billion in FY2024 revenue, up from $2.4 billion in FY2023, with 5 percent organic growth (Aon 2024 10-K). The Aon Active Health Exchange places employer clients into a private exchange structure where Aon acts simultaneously as the benefits architect, the exchange operator, and the carrier-facing broker: consulting fees plus commissions in a single relationship. This combination creates the exact selection-bias structure that the CAA 2021 disclosure rule was designed to surface. Aon's 2020 federal lobbying disclosed $1.51 million; 2022 lobbying reached $2.58 million (OpenSecrets). Estimated 2020-2024 cumulative lobbying: $9-13 million.
Sources: Marsh McLennan Companies (MMC) 2024 Form 10-K and 2025 DEF 14A Proxy Statement; Willis Towers Watson (WTW) 2024 Form 10-K and 2025 DEF 14A Proxy Statement; Aon plc (AON) 2024 Form 10-K and 2025 DEF 14A Proxy Statement; all via SEC EDGAR. CEO-to-median-worker pay ratios per AFL-CIO PayWatch (2024 filings). Federal lobbying disclosures via OpenSecrets.org (2020-2024 cycles).
The Fix
The legal infrastructure already exists. ERISA Section 408(b)(2)(B) requires brokers and consultants to disclose what they are being paid. The prudent-fiduciary duty is in the statute. What is missing is a Department of Labor rule defining what "prudent" purchasing of health plan administration looks like, and the public benchmark a court can point to when a plaintiff says a fee was unreasonable.
The retirement-plan world has lived through this transition. Twenty years ago, 401(k) administrative fees were similarly opaque. DOL issued specific guidance on what fiduciaries had to consider. Plaintiffs' lawyers built precedent. Fees compressed by 20 to 30 percent within five years. Health welfare plans are roughly where retirement plans were before that wave.
Three steps would close the gap, in increasing order of difficulty.
1. Publish the benchmark. This issue does. Every plan in our Schedule C sample has a peer-group P50 for admin fees per participant by size band and funding type. Lewandowski and Navarro dismissed for lack of a public reference; we built one. It does not solve individualized standing in a class action, because plan-level variance is too wide for any public dataset to substitute for a claims audit. It does give DOL a screening tool. A plan whose disclosed admin fees run ten times its peer median is now identifiable from public filings, and it is an audit candidate.
2. Make CAA 2021 actually bite. Three legislative amendments close the gap between disclosure and action:
- Extend broker-commission disclosure from the fiduciary to the plan participant. The participant pays the cost in wages; the participant should see the fee.
- Require self-insured plan fiduciaries to demonstrate at each renewal that negotiated rates fall within a defined band of Medicare or an approved reference price.
- Extend Schedule C filing requirements to mid-size plans (500 to 5,000 participants), which currently file only the abbreviated Form 5500-SF, where the fiduciary gap is probably sharpest.
3. Address the underlying price. Better fiduciary discipline cannot fix what we documented in Issue #3: commercial hospital prices run 254 percent of Medicare across more than 4,000 hospitals (RAND Round 5.1). A self-insured ERISA plan still pays whatever the hospital-PBM-insurer stack charges, and the stack charges a lot. The structurally coherent long-term answers are a Medicare buy-in for employers and Maryland-style all-payer rate setting. Both are politically distant.
Until one of those happens, the employer remains the payer of last resort for the system's excess, and the worker remains the place where that excess lands.
Savings Tracker: $435.2 Billion and Counting
$435.2 billion per year in identified, booked, and recoverable waste across nine published issues of The American Healthcare Conundrum.
[Chart: Savings Tracker]
Issue #9 adds $6.6 billion from two independent mechanisms: above-benchmark broker compensation in fully insured and self-insured ERISA health plans (Schedule A), and above-peer admin-fee variance in large health welfare plans (Schedule C), both from the DOL 2023 Form 5500 research file. We could not find a prior plan-level public analysis of the post-CAA 2021 broker and service-provider data for health welfare plans, so we built one. If a prior analysis exists, we will update.
The range is $6.6 billion to $12.2 billion. The booked figure uses the conservative (30 percent) reducibility assumption on Component C and does not extrapolate the in-sample variance rate to the 63 million out-of-sample ERISA-welfare participants. The CTA above explains what data would resolve the range.
Methodology notes for all published issues:
Issue #1 OTC Drugs: $0.6B from Part D coverage of brand drugs with OTC equivalents; CMS Part D Public Use File 2023, step-therapy crosswalk analysis. Issue #2 Drug Pricing: $25.0B from 9 top-spend Medicare brand drugs versus international prices; CMS Part D PUF 2023, NHS Drug Tariff (March 2026), RAND RRA788-3, Peterson-KFF. Net-adjusted at 49% rebate for top-spend brand drugs. Issue #3 Hospital Pricing: $73.0B from commercial reference pricing at 200% of Medicare (currently at 254%); RAND Round 5.1, CMS HCRIS FY2023 (3,193 hospitals), CMS NHE 2023. Issue #4 PBMs: $30.0B from PBM spread pricing, rebate retention, and biosimilar non-adoption gap; FTC Interim Reports I and II, Ohio Auditor data, CMS Part D PDE. Issue #5 Admin Waste: $200.0B from structural billing complexity and prior auth processing cost; Woolhandler/Himmelstein updated 2023, HCRIS admin variance (4,518 hospitals), AMA PA Survey 2024. Issue #6 Supply Waste: $28.0B from hospital supply cost variance (Q4 to P75 within peer groups); CMS HCRIS FY2023 Worksheet A (5,480 hospitals). Issue #7 GLP-1 Pricing: $40.0B from US-to-international price gap in GLP-1 receptor agonists and BALANCE model optimization; CMS NHE, OECD, Novo Nordisk and Eli Lilly filings. Issue #8 Denial Machine: $32.0B from prior authorization reform ($10.4-17.0B care suppression), vertical integration restrictions ($6.7-13.8B margin arbitrage), AI regulation ($4.9-6.4B denial escalation), and MA risk adjustment audits ($0.3B); CMS-0057-F, KFF CY2024 Part C data, Health Affairs 2025. Issue #9 Employer Trap: $6.6B from above-benchmark broker compensation and above-peer admin-fee variance in ERISA health welfare plans; DOL Form 5500 Schedule A and Schedule C 2023 research file. Plan-level analysis of post-CAA 2021 disclosures.
Denominator: $3.24 trillion US-Japan per-capita spending gap (US per-capita $15,474, Japan $5,790, US population ~336 million; CMS NHE 2024 final, OECD Health at a Glance 2025). Issue #9 is the first issue at the revised $3.24T denominator; Issues #1-#8 were published using the prior $3T denominator and are not retrofitted. The running total at $435.2B represents 13.4 percent of the $3.24T gap.
What's Next
Issue #10: The Procedure Mill. Physicians say roughly one in five medical decisions in the US is unnecessary, and for procedures specifically the figure is closer to one in nine (Lyu, Wick, Cabrera, Makary, Overtreatment in the United States, PLOS ONE, 2017). The Lown Institute estimates $75 to $100 billion in low-value care annually. The Choosing Wisely initiative has named more than 600 procedures that evidence does not support for most patients. Medicare claims data lets us compute the volume, cost, and geographic distribution of overuse at the procedure level. Issue #10 builds that case: who performs low-value care, who pays for it, and what it would take to stop.
Every script is on GitHub. Every number can be verified. If you think we got something wrong, open an issue: github.com/rexrodeo/american-healthcare-conundrum
If you found value in this work, forward it to someone who should see it.
[Subscribe to The American Healthcare Conundrum]
Sources: Hager K, Emanuel EJ, Mozaffarian D, Employer-Sponsored Health Insurance Premium Cost Growth and Its Association With Earnings Inequality Among US Families, JAMA Network Open (January 16, 2024), doi:10.1001/jamanetworkopen.2023.51644; Monahan AB, Richman BD, Hiding in Plain Sight: ERISA's Cure for the $1.4 Trillion Health Benefits Market, 42 Yale Journal on Regulation 234 (2025); Richman BD, Monahan A, Singer S, Pfeffer J, ERISA and the Failure of Employers to Perform their Fiduciary Duties, Journal of Law, Medicine and Ethics (September 2025), SSRN 5292797; Lewandowski v. Johnson and Johnson, No. 3:24-cv-00671-ZNQ-RLS, slip op. (D.N.J. Nov. 26, 2025) (dismissing for lack of Article III standing); Navarro v. Wells Fargo and Co., 2025 WL 897717, No. 0:24-cv-03043 (D. Minn. Mar. 24, 2025) (dismissing for lack of Article III standing); US Department of Labor EBSA, Report to Congress: Annual Report on Self-Insured Group Health Plans (2025 edition, based on 2022 Form 5500 filings), pp. 8-9, Table 1; DOL Form 5500 Schedule A and Schedule C research files, plan year 2023 (Latest release); KFF Employer Health Benefits Survey 2024 and 2025; MEPS-IC 2024 state and national public tables (AHRQ); Baicker K, Chandra A, The Labor Market Effects of Rising Health Insurance Premiums, Journal of Labor Economics 24(3):609-634 (2006); Allen M, Behind the Scenes, Health Insurers Use Cash and Gifts to Sway Which Benefits Employers Choose, ProPublica (February 20, 2019); RAND Corporation, Employers' Forum of Indiana Hospital Price Transparency Study (Round 5.1, 2023); PatientRightsAdvocate, Hospital Price Transparency Compliance Report (July 2025); Marsh McLennan Companies (MMC) 2024 Form 10-K and 2025 DEF 14A Proxy Statement; Willis Towers Watson (WTW) 2024 Form 10-K and 2025 DEF 14A Proxy Statement; Aon plc (AON) 2024 Form 10-K and 2025 DEF 14A Proxy Statement; all via SEC EDGAR; federal lobbying disclosures via OpenSecrets.org (2020-2024 cycles); DOL CAA Enforcement Policy announcement (December 30, 2021); BLS Employer Costs for Employee Compensation quarterly series (2014-2025); CMS National Health Expenditure Accounts 2024 (final release).
Savings Tracker (consolidated):
$435.2 billion per year in identified, booked, and recoverable waste across nine published issues of The American Healthcare Conundrum.
The $3.24 trillion annual spending gap between the United States and Japan per-capita healthcare costs is the north star. Every dollar identified is independently defensible through published research, federal datasets, or peer-reviewed analysis. No speculation. No attribution without source. All analysis uses public data.
The American Healthcare Conundrum publishes when the data is ready. All analysis uses publicly available data. Code is open-source. Figures are validated before publication.
Get every issue in your inbox
The American Healthcare Conundrum is free. One fixable problem in U.S. healthcare, with the data, every week.