Issue #19: The 340B Spread
How hospitals buy drugs at steep federal discounts, bill insurers at full price, and keep $10.3 billion per year more than they deliver in documented charity care
Each issue of The American Healthcare Conundrum identifies one fixable problem in U.S. healthcare spending, builds the data case, and recommends a specific policy fix. All analysis uses publicly available data. Code is open-source.
Target: ~$3.24T US-Japan per-capita spending gap
(Japan: highest life expectancy, lowest infant
 mortality in OECD, ~half US per-capita spend)

Full scale: $0 ─────────────────────────── $3.24T
            █████░░░░░░░░░░░░░░░░░░░░░░░░  16.8%
            ↑ $545.25B identified

Per-issue savings (1 block ≈ $8B; max bar = $200B):
 #1 ▏                          $0.6B   OTC Drug Overspending
 #2 ███                       $25.0B   Drug Pricing
 #3 █████████                 $73.0B   Hospital Pricing
 #4 ████                      $30.0B   PBM Reform
 #5 █████████████████████████ $200.0B  Admin Waste
 #6 ███                       $28.0B   Supply Waste
 #7 █████                     $40.0B   GLP-1 Pricing
 #8 ███                       $24.0B   Denial Machine
 #9 █                          $6.6B   Employer Trap
#10 █                          $7.6B   Procedure Mill
#11 ████                      $28.0B   MA Overpayment
#12 ██                        $13.0B   Consolidation Tax
#13 █                          $5.4B   Nonprofit Lie
#14 ████                      $27.6B   Specialist Tax
#15 ▏                          $2.6B   Facility Fee Scam
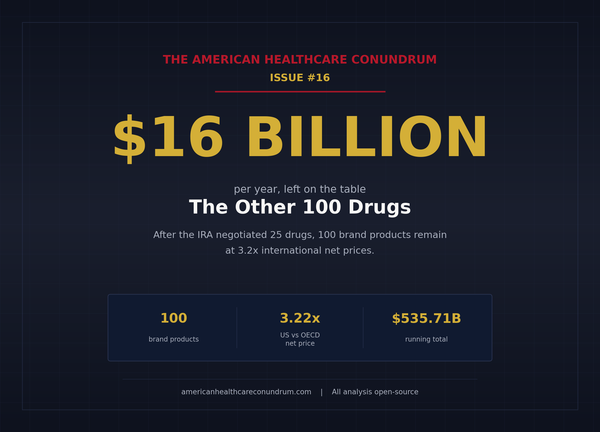
#16 ██                        $16.4B   The Other 100 Drugs
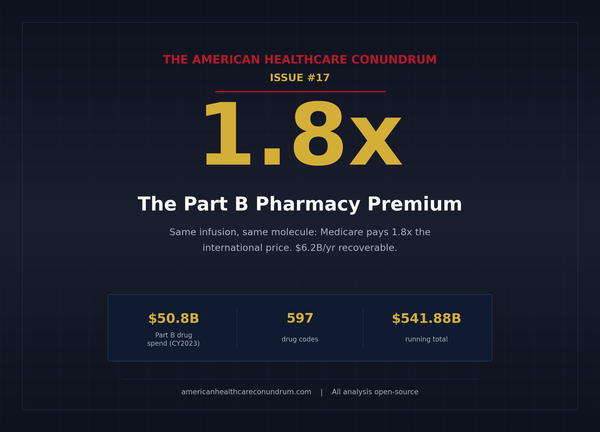
#17 █                          $6.2B   Part B Pharmacy Premium
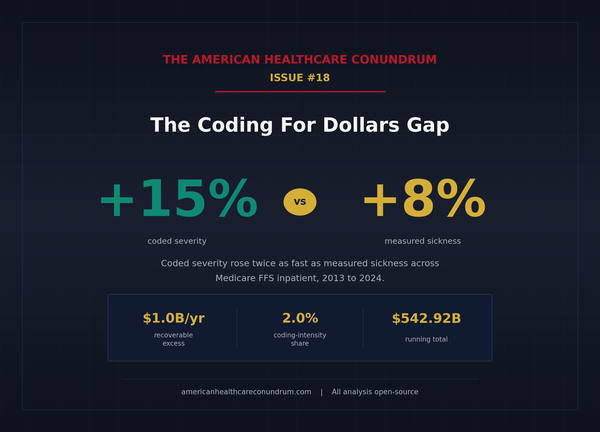
#18 ▏                          $1.0B   Coding for Dollars
#19 █                         $10.3B   The 340B Spread (this issue)
   ──────────────────────────────────────────────────
   Total: $545.25B  ·  $2,694.75B remaining
   Scale: $3.24T (CMS NHE 2024; Japan OECD 2023)
Congress created the 340B Drug Pricing Program in 1992 with a stated purpose: let safety-net hospitals and clinics buy outpatient drugs at a steep discount, so they could stretch limited resources to serve more uninsured and low-income patients. The mechanism was simple. Manufacturers, as a condition of participating in Medicaid, would sell qualifying providers the same drugs at a formula-set ceiling price. Covered entities could then bill insurers at the full rate and keep the spread. A discount meant to reach patients who lacked coverage.
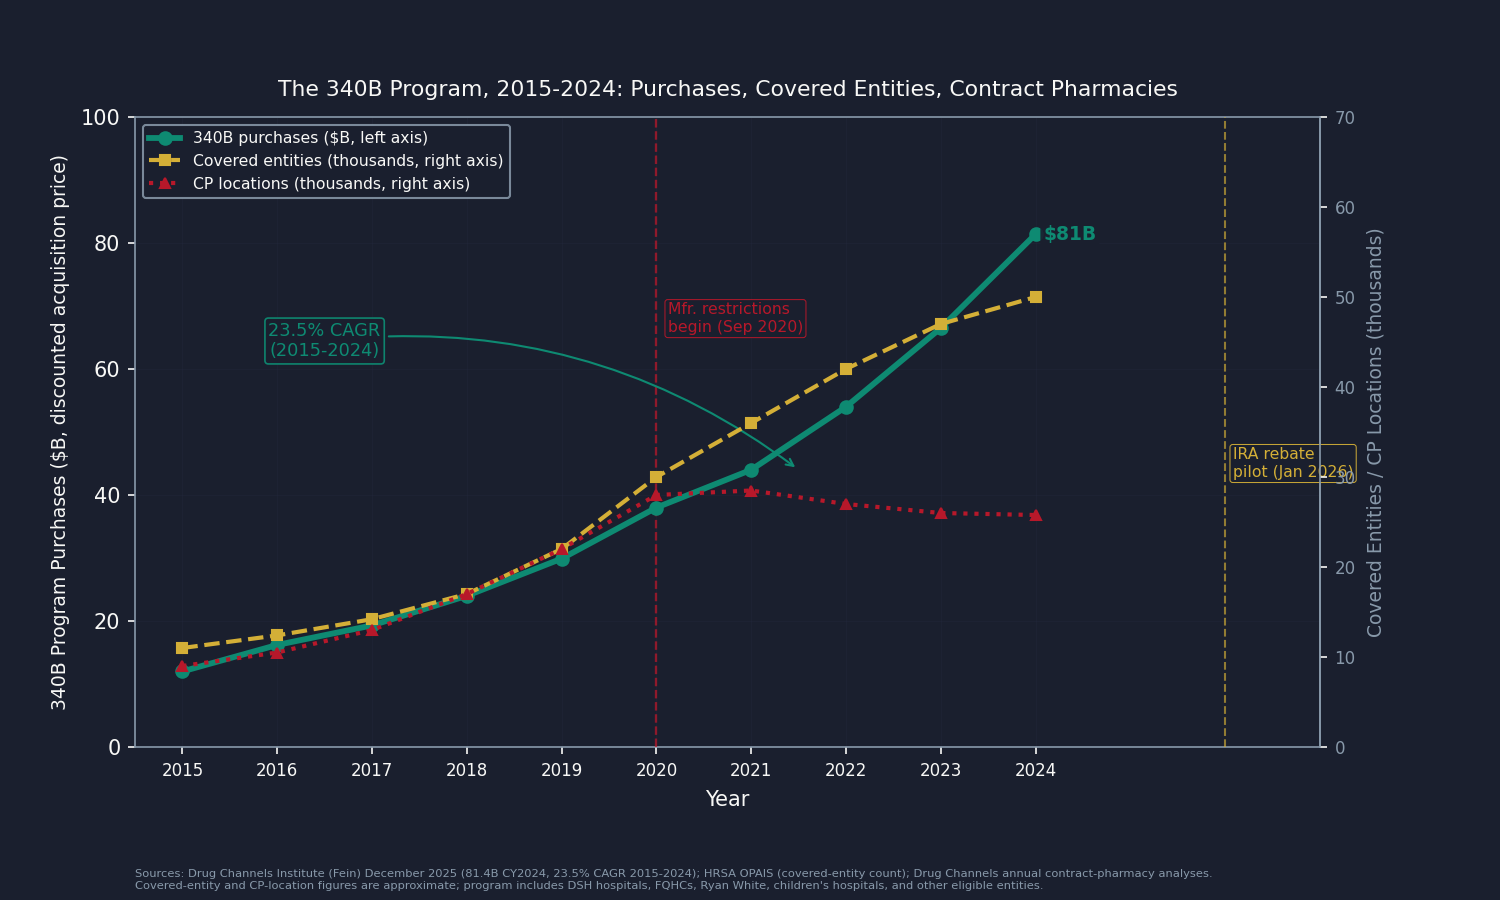
Three decades later, the program purchases $81.4 billion in drugs annually at 340B prices, up 23.5 percent per year since 2015 (Drug Channels Institute, December 2025). It is now larger than Medicaid net prescription drug spending. The discount is real, and for a subset of the hospitals in the program it works exactly as designed. But the 1992 statute contains no requirement that the discount reach a single patient.
That design gap is what this issue measures.
The 340B Program, By the Numbers
The largest segment of the 340B program, by purchase volume, is the Disproportionate Share Hospital (DSH) segment: nonprofit and government hospitals that, under federal statute, serve disproportionately high shares of Medicaid and uninsured patients. Across 1,986 of these hospitals, this analysis joins Health Resources and Services Administration (HRSA) registration data with hospital financial records to estimate the spread each hospital captures, then compares it to the charity care each hospital delivers.
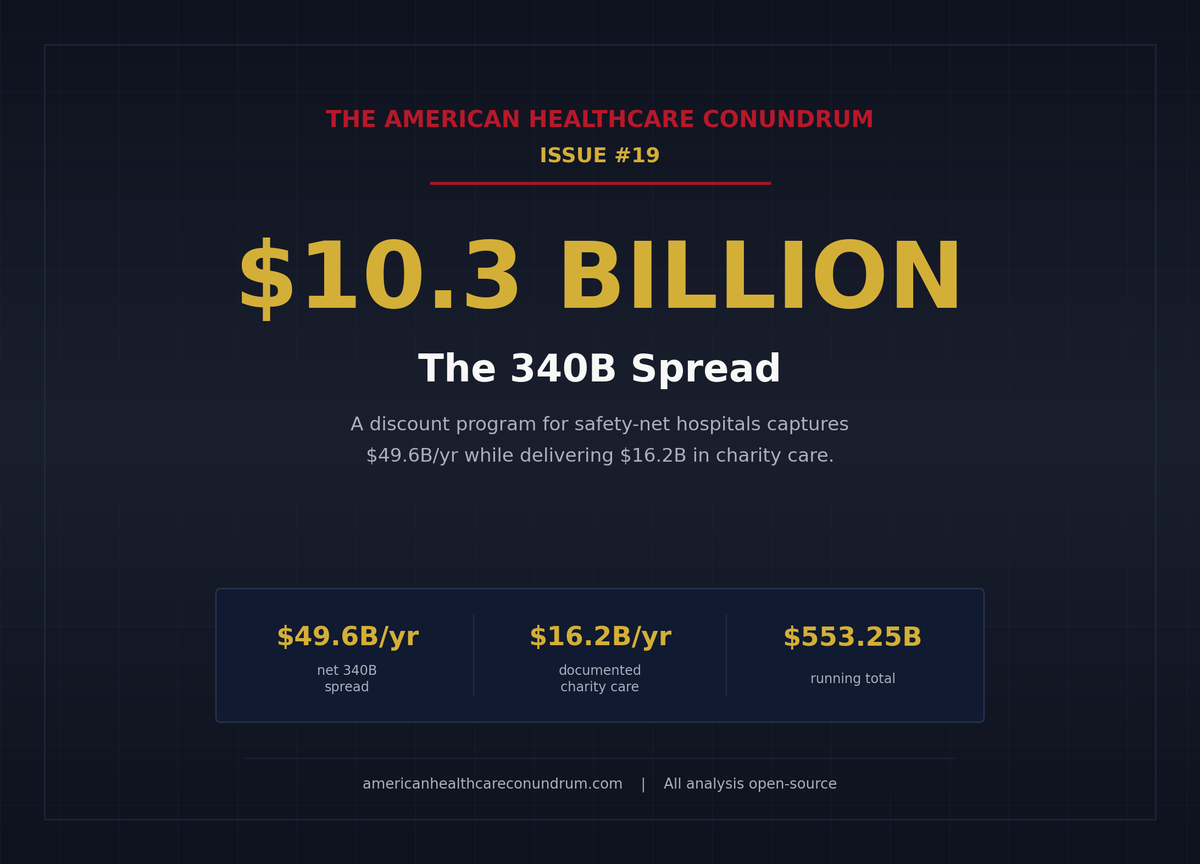
The aggregate result is the headline: DSH hospitals in the 340B program capture an estimated $49.6 billion in net spread from drug purchases annually. The same hospitals deliver $16.2 billion in financial assistance to patients at cost, drawn from Internal Revenue Service (IRS) Form 990 Schedule H financial-assistance-at-cost reporting. Net spread is roughly three times documented charity care.
That gap, concentrated and measurable, is what this issue books.
What the Program Looks Like From the Inside
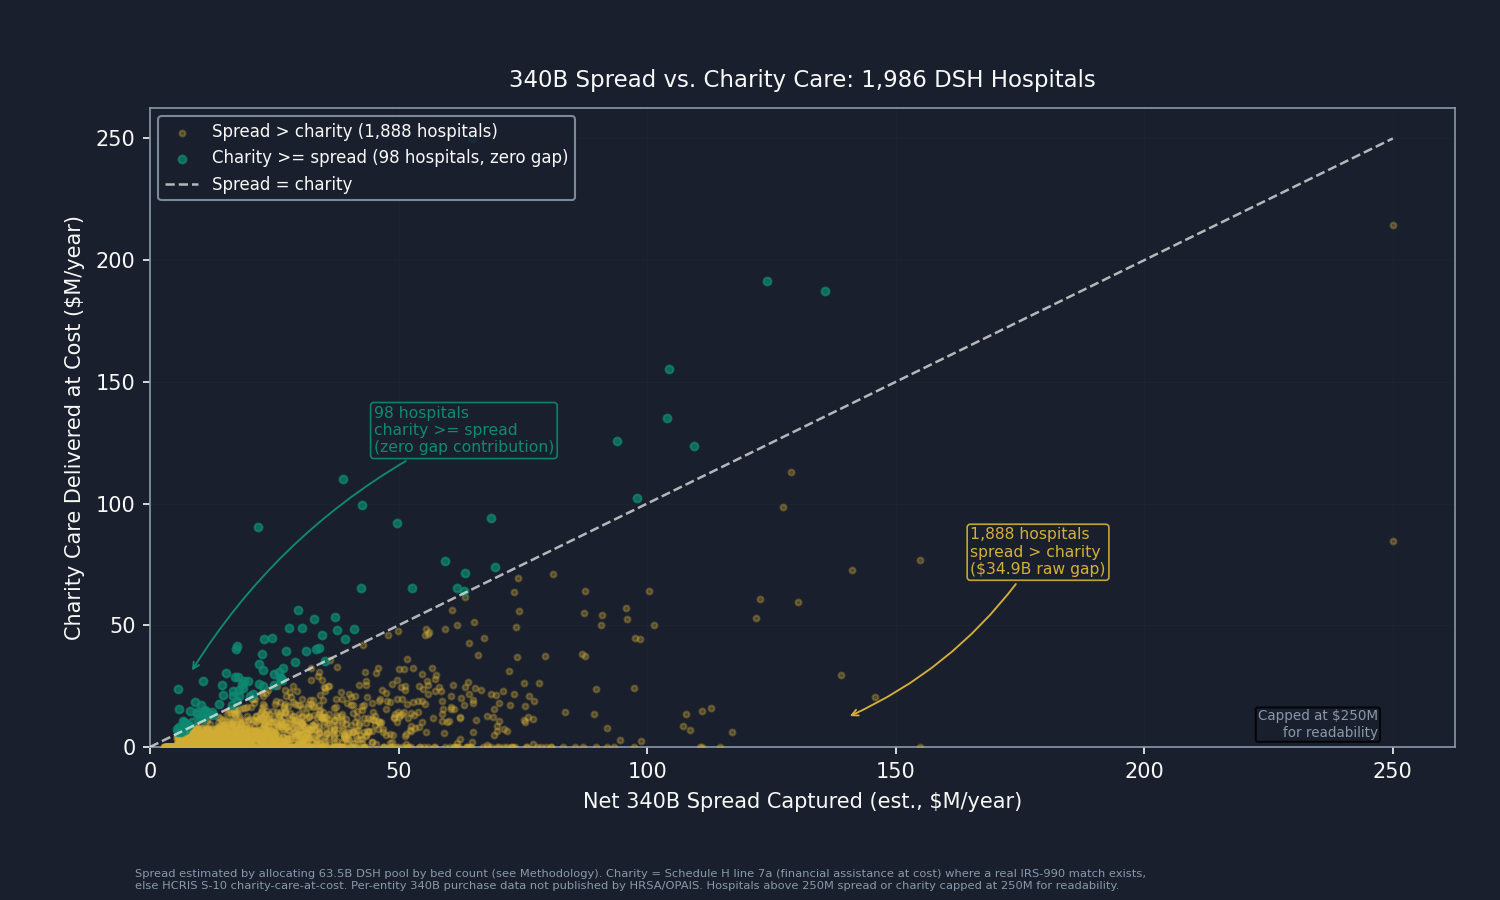
Ninety-eight of the 1,986 hospitals in this analysis deliver charity care that meets or exceeds their estimated spread, contributing zero to the gap this issue books. These are facilities where 340B functions as designed: a large public hospital in an impoverished county, a critical access hospital serving an uninsured rural population, a government safety-net system whose charity-care costs are genuinely subsidized by program spread. They prove the program can work as intended.
The other 1,888 hospitals capture more spread than they return in documented charity care. Their aggregate gap is $34.9 billion before overlap adjustments. It is concentrated at the large end: New York-Presbyterian Hospital (2,850 beds, an estimated $190 million gap), Jackson Memorial (1,608 beds, $155 million), Norton Hospitals (1,515 beds, $126 million), Carolinas Medical Center (1,191 beds, $115 million), and Mayo Clinic Hospital Rochester (1,154 beds, $111 million) are among the largest individual gaps. These are not hospitals at risk of closing.
One limitation belongs here: the per-hospital 340B purchase volumes in this analysis are estimated, not measured. HRSA does not publish how many 340B-priced drugs each covered entity purchases. The HRSA Office of Pharmacy Affairs Information System (OPAIS) provides registration data but not purchase data. This analysis allocates the national $63.5 billion DSH purchase pool using bed count as a proxy: larger hospitals receive a larger allocation.
That means large academic centers dominate the gap partly because larger hospitals get credited with more estimated dollars. It is a real limitation. So we ran the test rigged to favor the hospitals: give each one 340B purchases in exact proportion to the charity care it reported, so the ones delivering the most free care also get the most estimated spread. Even then, total spread still exceeds total charity, with a raw gap of $33.4 billion. Every allocation method we tried lands the gap between $33 and $37 billion. The direction holds.
The single dataset that would replace estimation with measurement is held by Apexus, the HRSA-designated 340B Prime Vendor, which holds per-entity purchase volumes. It does not make that data public. That is the lead data-partner ask for this issue.
The Mechanism
How the Spread Works
From the hospital's side, the mechanics are simple. It buys a drug at the federal 340B ceiling price, roughly 45 percent below the standard list price on average. It then bills the patient's insurer the same rate it would have billed anyway. The insurer's payment does not shrink because the hospital got a discount. The difference is income to the hospital.
The ceiling price is set by a formula tied to the Average Manufacturer Price (AMP), which each manufacturer reports to the Centers for Medicare and Medicaid Services (CMS) every quarter. The 340B price comes out at least 23.1 percent below that, and often more. The result is a deep discount off the standard commercial list price, the Wholesale Acquisition Cost (WAC). Across the current $81.4 billion program, that discount runs about 44.9 percent, a spread of roughly $66.4 billion (IQVIA, CY2024 data).
On the billing side, Medicare Part B pays the Average Sales Price (ASP) plus 6 percent regardless of whether the drug was acquired at the 340B ceiling or at WAC. Commercial insurance pays the negotiated rate. Neither payer asks what the hospital paid.
The 1992 statute, codified at 42 U.S.C. Section 256b, sets only one restriction: the covered entity may not transfer a 340B-priced drug to anyone other than a patient of the entity. It does not require the entity to apply the spread to charity care, to reduce patient cost-sharing, or to disclose how the spread is used.
The Contract-Pharmacy Layer
When a drug is dispensed through a contract pharmacy (a chain pharmacy with a dispensing agreement with the covered entity, rather than the hospital's own in-house pharmacy), the chain collects a fee. Senator Cassidy's May 2025 Senate Health, Education, Labor, and Pensions (HELP) Committee investigation found that CVS Health alone collected $382 million in 340B contract-pharmacy fees in 2023 (Drug Channels, May 2025 analysis of Cassidy investigation). Aggregate contract-pharmacy (CP) fee retention across the program was approximately $3.0 billion, concentrated almost entirely in Walgreens and CVS, which have registered more than 90 percent and more than 75 percent of their U.S. locations, respectively, as 340B contract pharmacies.
The covered entity keeps what the contract pharmacy does not. The aggregate CP fee total ($3.0 billion whole-program, $2.34 billion on the DSH share at central) is subtracted from gross spread in this analysis, yielding $49.6 billion in net spread captured by DSH hospitals.
The Manufacturers Are Not Heroes Either
Beginning in September 2020, Eli Lilly, AstraZeneca, Sanofi, and eventually more than a dozen other manufacturers began unilaterally restricting 340B-priced drug shipments to contract pharmacies, citing program-integrity concerns. HRSA sent enforcement letters in 2021 requiring six manufacturers to resume compliance. The Third Circuit ruled in 2024 that manufacturers are not statutorily required to ship to unlimited contract pharmacies; other circuits have ruled differently. The Supreme Court has not resolved the split.
Each restricted 340B sale converts into a higher-margin commercial sale. When a covered entity cannot obtain a drug at the 340B ceiling price, it purchases at WAC. The manufacturer captures the full margin. That is its own margin play, not only a compliance position.
There is also the matter of what the government took from 340B hospitals on the other side. The Supreme Court's 2022 ruling in American Hospital Association v. Becerra found, 9 to 0, that CMS lacked statutory authority to cut Outpatient Prospective Payment System (OPPS) reimbursement rates for 340B-acquired drugs without conducting an acquisition-cost survey. CMS had cut those rates in 2018 and 2019. The underpayment to 340B hospitals over 2018 through mid-2022 was approximately $10.6 billion; CMS is now repaying $7.8 billion starting in fiscal year 2026, amortized over 16 years (CMS-1793-F, November 2023). The picture is not one-sided.
Where Does the Money Go?
Two teams of researchers asked the simple version of the question this issue books: when a hospital gets the 340B discount, where does the money go? They used methods that do not lean on our bed-count estimate, and both landed in the same place.
Conti and Bach, in Health Affairs in 2014, took 960 hospitals and their 3,964 satellite clinics and looked up the neighborhoods those clinics sat in, using Census data. In 2004, the program had loosened the rules for adding off-site clinics. The clinics added after that served wealthier, better-insured neighborhoods than the ones added before it. As the program grew, it grew toward the communities that needed the help least. A 2025 follow-up in Health Affairs Scholar ran the same test on newer data and found the pattern still held.
Desai and McWilliams, in the New England Journal of Medicine in 2018, watched what hospitals did right after they became eligible. The hospitals hired far more cancer doctors (230 percent more) and billed Medicare for far more infused cancer drugs (90 percent more), among the most profitable things a hospital can administer. What did not budge was care for low-income patients. There was no measurable increase.
The point is not that these hospitals are villains. The incentives push the money toward profitable services and better-off neighborhoods, not toward the uninsured. The 98 hospitals in our analysis that give away more free care than they capture in spread are the proof that the safety-net mission still works where the money is aimed at it.
A 2024 analysis by the Alliance for Integrity and Reform of 340B (AIR340B) reached the same conclusion from the opposite direction: it measured the margin hospitals make selling the drugs, where we measured the discount they get buying them. Same finding, for most of the program spread runs well ahead of charity care. AIR340B is funded by drug manufacturers, who have their own reasons to say so. Even so, its charity-care number ($18.5 billion for 2022) sits close to our independent estimate ($16.2 billion for 2024).
The Savings Opportunity
$10.3 billion per year in recoverable gap between 340B spread captured and charity care delivered, concentrated in a large subset of DSH hospitals.
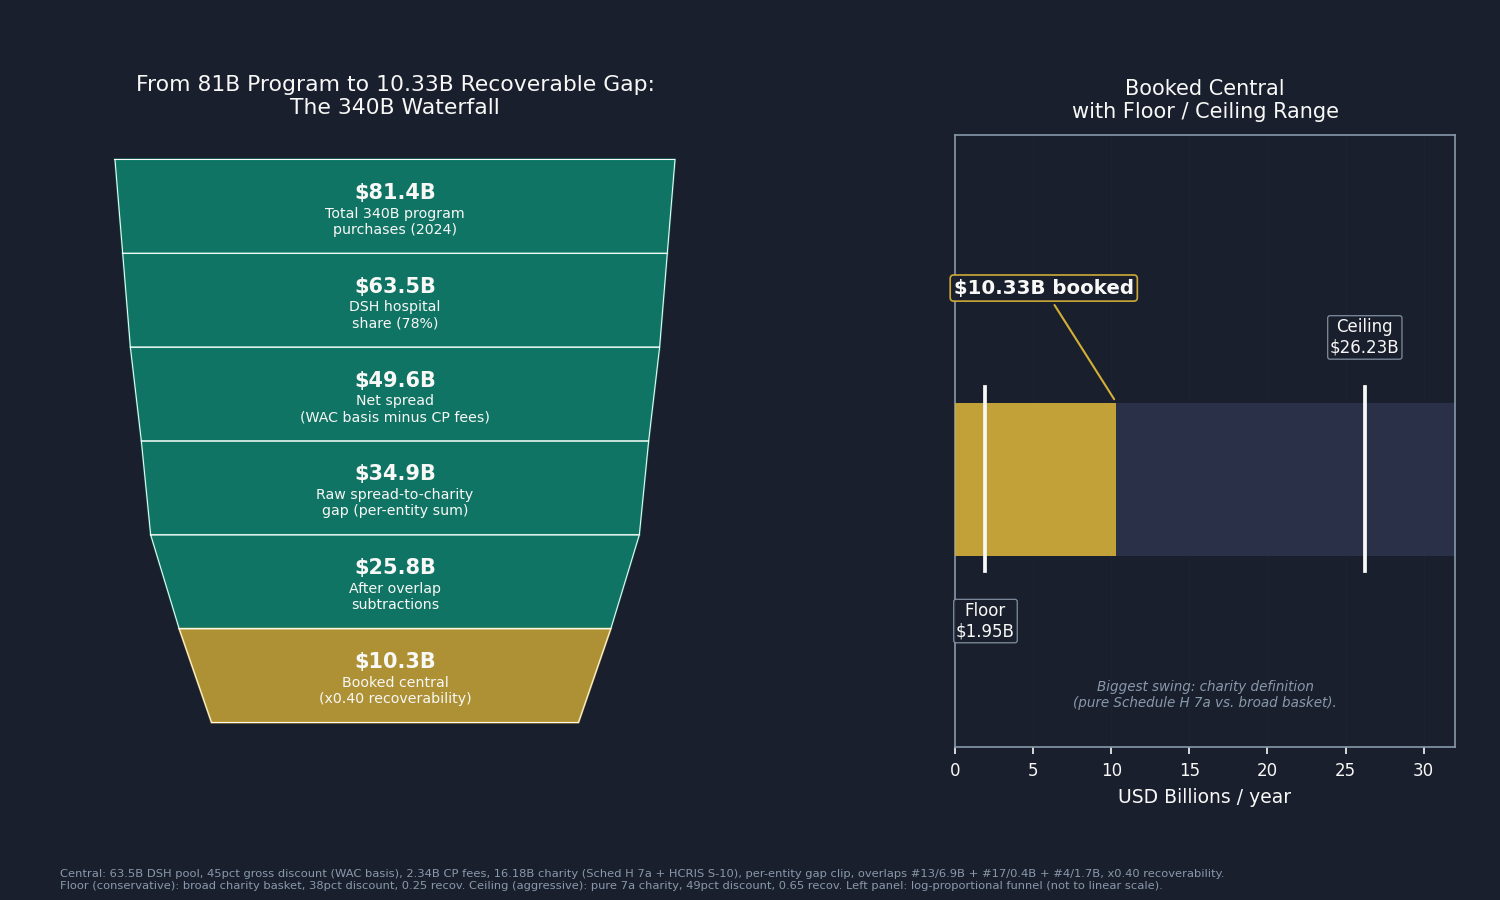
The waterfall: $81.4 billion in 2024 program purchases at discounted prices (Drug Channels, December 2025), of which 78 percent flowed through DSH hospitals, yields a $63.5 billion DSH pool. The same drugs carry a WAC list value of approximately $147.8 billion program-wide (IQVIA, CY2024). The gross discount on the DSH share, computed on the WAC basis, is $51.95 billion at the central discount rate. Subtracting $2.34 billion in contract-pharmacy fees, calibrated to the Cassidy-confirmed whole-program $3.0 billion CP fee benchmark, leaves $49.61 billion in net spread retained.
Against that spread, the same 1,986 DSH hospitals deliver $16.18 billion in charity care at cost, drawn from IRS Form 990 filings where a match exists and hospital cost reports for the rest. Then we ask one question of each hospital: did it keep more in spread than it gave away in free care? If yes, the excess counts; if no, it counts as zero, not as a credit. Summed across the 1,888 hospitals that kept more than they gave, the raw gap is $34.86 billion.
From that raw gap we subtract three overlaps so no dollar is counted twice: $6.89 billion already counted in Issue #13: The Nonprofit Lie, for the 606 hospitals that fail both tests; $0.40 billion with Issue #17: The Part B Pharmacy Premium, which set aside the 340B-acquired share for this issue; and $1.74 billion with Issue #4: The Middlemen, where some of these same contract-pharmacy fees were already booked. That leaves $25.83 billion. We keep 40 percent, the share a realistic reform could actually recover, and book $10.33 billion per year.
The range is $1.95 billion to $26.23 billion. The biggest swing in that range is the definition of charity. The central estimate counts charity care at cost specifically: free and discounted care to patients (Schedule H line 7a financial assistance where matched, HCRIS S-10 at cost otherwise). We use it because that is the care the 1992 statute promised the uninsured. Count the full Schedule H community-benefit basket instead (which also folds in Medicaid shortfall, subsidized services, community health programs, training, and research) and the recoverable figure shrinks toward the low end of our range.
Who Profits
The contract-pharmacy ecosystem sits at the center of the spread's distribution. Covered entities use Walgreens and CVS to dispense roughly 55 percent of 340B drugs (Drug Channels), and the chains collect fees on each dispense. On the supply side, manufacturers restricting contract-pharmacy access are pursuing their own margin, as described above.
Walgreens Boots Alliance (WBA) FY2024 Revenue: $147.7B | Operating Margin: negative (FY2024 GAAP operating loss of $14.1B, driven by a $12.4B VillageMD goodwill impairment) | CEO Comp (Tim Wentworth, named Nov 2023): $13.3M This issue's mechanism: More than 90 percent of U.S. Walgreens locations are registered as 340B contract pharmacies, amounting to an estimated 46,100 contractual relationships with covered entities (Senator Cassidy May 2025 investigation; Drug Channels). Each 340B dispense generates a fee, typically representing a portion of the gross 340B discount. Walgreens has expanded its 340B contract-pharmacy business even as it has closed general retail locations, indicating the 340B fee stream is a meaningful margin contributor in a period of financial stress.
CVS Health (CVS) FY2024 Revenue: $372.8B | Operating Margin: 2.3% (GAAP operating income $8.5B) | CEO Comp: David Joyner (named Oct 2024) $17.8M; Karen Lynch (CEO through Oct 2024) $23.4M This issue's mechanism: More than three-quarters of U.S. CVS locations are registered as 340B contract pharmacies. CVS collected $382 million in 340B contract-pharmacy fees in 2023, the only per-company figure publicly confirmed by the Cassidy investigation (Drug Channels, May 2025). CVS was previously profiled in Issue #4: The Middlemen and Issue #8: The Denial Machine on the pharmacy-benefit-manager surface; the contract-pharmacy fee mechanism here is distinct and additive.
Eli Lilly and Company (LLY) FY2024 Revenue: $45.0B | Operating Margin: 28.6% | CEO Comp (David Ricks): $29.2M (SEC DEF 14A, April 2025) This issue's mechanism: Eli Lilly was the first manufacturer to restrict 340B-priced drug shipments to contract pharmacies (September 1, 2020), initially requiring covered entities to use only a single contract pharmacy unless they provided claims-level detail through Lilly's 340B ESP reporting platform. Each sale Lilly shifts from the 340B ceiling price back to WAC generates margin equal to the 340B discount on that unit. Lilly's two GLP-1 drugs (Mounjaro and Zepbound) reached approximately $18 billion in FY2024 revenue; the contract-pharmacy restriction preserves the full WAC margin on those drugs when dispensed outside in-house 340B pharmacies.
Sources: Walgreens Boots Alliance FY2024 Form 10-K via SEC EDGAR; CVS Health FY2024 Form 10-K and DEF 14A via SEC EDGAR; Eli Lilly FY2024 Form 10-K and DEF 14A via SEC EDGAR (April 2025); Senator Bill Cassidy May 2025 Senate HELP Committee investigation (CVS $382M 2023 CP fees, $3.0B aggregate CP retention estimate; help.senate.gov; Drug Channels May 2025 analysis); Drug Channels Institute annual contract-pharmacy market analyses 2022-2025; OpenSecrets.org federal lobbying disclosure database (2020-2024).
The Fix
The Government Accountability Office (GAO) issued its first 340B oversight report in 2011 (GAO-11-836). Its October 2025 report (GAO-26-108784) found that HRSA had implemented 5 of 20 prior recommendations. Fifteen years of audits. Five of twenty actions. The structural reason is not mystery: HRSA has historically lacked enforcement authority for several recommendations, and the hospital lobby has consistently opposed pass-through requirements that would reduce program revenue.
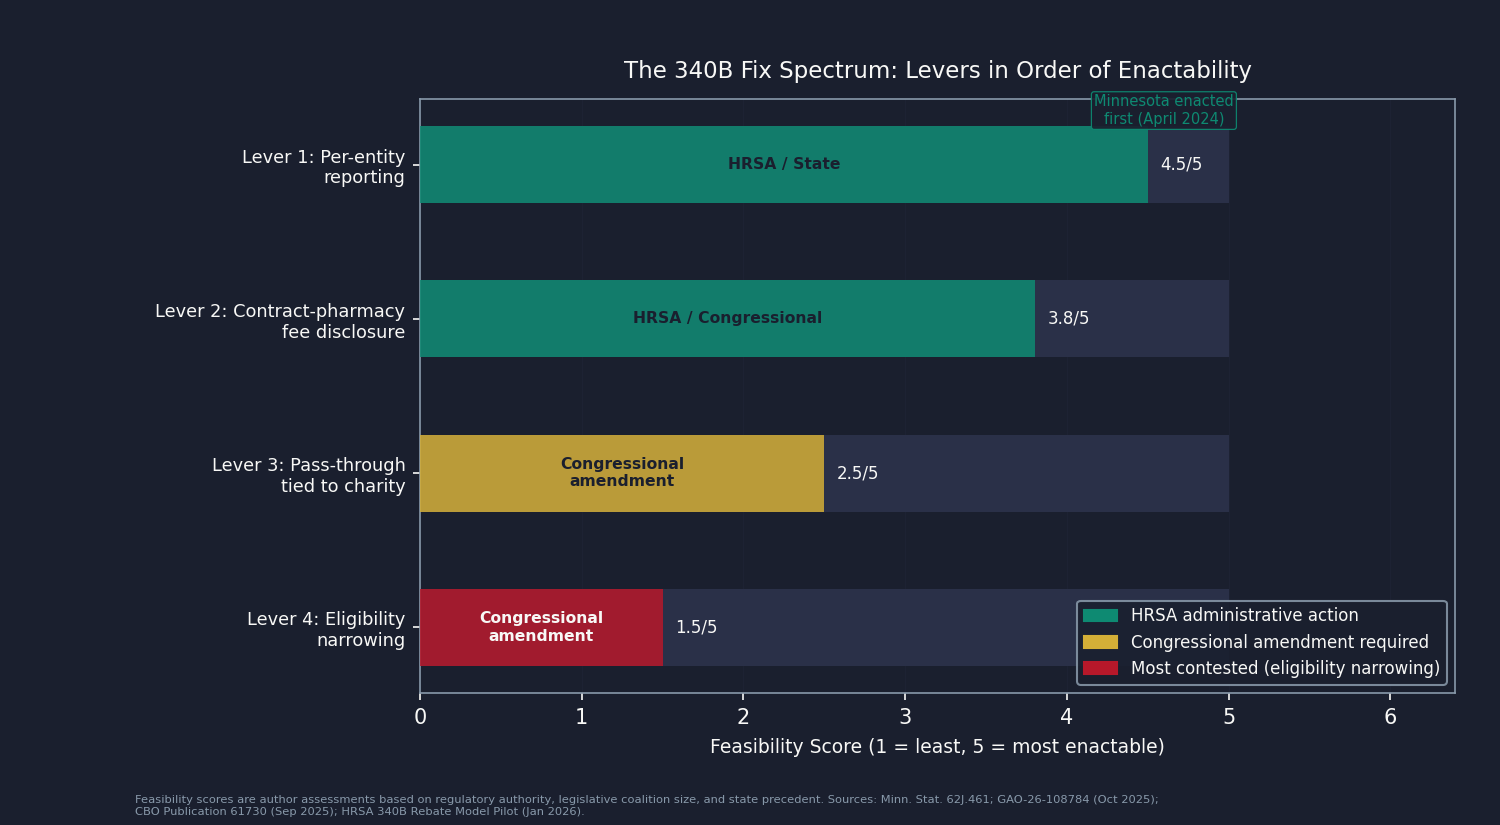
There are four levers, ordered by the likelihood of enacting them.
Lever 1: Per-entity reporting (most feasible). Minnesota became the first state to require 340B covered entities to report drug acquisition costs, payments received, and contract-pharmacy fees paid, under Minnesota Statute Section 62J.461, with first reports due April 1, 2024. Maine enacted the nation's second such law in 2024. The OPAIS infrastructure HRSA already operates could support federal-level reporting without new systems. A federal mandate would make observable the gap this analysis currently estimates. Authority: HRSA administrative action or Congressional mandate.
Lever 2: Contract-pharmacy fee disclosure. The Cassidy investigation established the framework: require covered entities and contract-pharmacy chains to disclose, annually and per entity, the fees collected on 340B dispenses. The $382 million CVS figure and the approximately $3 billion whole-program total were obtained through Senate investigation, not routine disclosure. Mandatory disclosure would make this a standing public figure rather than an occasional investigative finding. Authority: HRSA administrative action or Congressional mandate.
Lever 3: Pass-through tied to documented charity care (requires statutory amendment). The most direct fix: require covered entities to document that 340B spread is applied, proportionally, to charity care or reduced patient cost-sharing, using the Schedule H reporting infrastructure already in place. Any hospital delivering charity care equal to or exceeding its estimated spread (the 98 hospitals in the over-delivering cohort) would be unaffected. The fix targets the gap, not the program. The HRSA 340B Rebate Model Pilot, effective January 1, 2026, scoped initially to 9 of the Inflation Reduction Act (IRA)-negotiated drugs, demonstrates that per-claim 340B transaction accounting is technically feasible (HFMA, early 2026 update). Expanding the rebate model's tracking infrastructure would create the data foundation for enforceable pass-through. Authority: Congressional amendment to 42 U.S.C. Section 256b.
Lever 4: Covered-entity eligibility narrowing (most contested). Tightening the DSH disproportionate-share adjustment threshold (currently 11.75 percent) or narrowing the child-site registration framework would return the program's eligibility to the concentrated safety-net population it originally served. The Congressional Budget Office (CBO) September 2025 analysis (CBO publication 61730) found that roughly two-thirds of program growth since 2010 reflected 340B-specific factors (hospital vertical integration into off-site clinics, relaxed HRSA registration guidance) rather than broader prescription-drug spending trends. The political coalition for eligibility narrowing is weaker than for reporting, because eligibility changes threaten program revenue for the entire hospital lobby, not just the gap subset. Authority: Congressional amendment.
Congress holds the authority for Levers 3 and 4. HRSA can act administratively on Levers 1 and 2. States have demonstrated Lever 1 is achievable right now without federal action.
What's Next
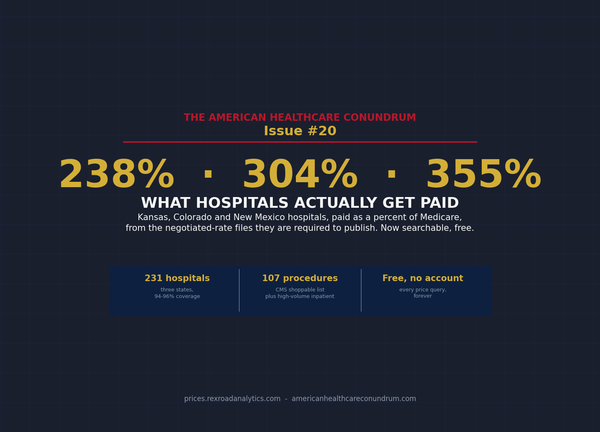
Issue #20: The Imaging Tax publishes July 12, 2026. The same CT scan Medicare prices at a few hundred dollars can cost a commercial insurer two and a half to three times as much at the same hospital. Hospitals are now federally required to publish their negotiated rates, so we pulled those files and measured the markup directly. Issue #20 puts a number on what that gap costs.
The primary data gap in this issue is per-entity 340B purchase volume. OPAIS does not publish it. Apexus, the HRSA-designated 340B Prime Vendor, holds per-entity transaction data that would replace this analysis's bed-count allocation with measured per-hospital purchase volume. Per National Drug Code (NDC) 340B ceiling prices, held by HRSA but not publicly disclosed, would enable a per-drug-class rather than composite discount computation. State All-Payer Claims Databases (APCDs), including Colorado CIVHC, can observe 340B-flagged claims at the prescription level. Organizations with access to any of these datasets: reach us at contact@ahcdata.fund or ahcdata.fund.
Worked inside the system? We talk with people who have worked inside 340B program administration, hospital pharmacy purchasing, contract-pharmacy operations, or the prime-vendor supply chain. If you can help us understand how these processes actually work, or point us to documentation that does, we would value a conversation, on background and in confidence. Reach us at contact@ahcdata.fund.
All analysis code is at github.com/rexrodeo/american-healthcare-conundrum. If the math looks wrong, say so.
If this issue was useful, forward it to someone who pays for drugs or hospital care, which is most of us eventually.
Sources: 42 USC 256b (Veterans Health Care Act of 1992 Section 602, 340B statutory text, govinfo.gov); Drug Channels Institute (Fein) December 2025 ($81.4B CY2024, 23.5% CAGR 2015-2024, entity-type shares, contract-pharmacy market analysis, drugchannels.net); IQVIA CY2024 ($147.8B WAC list value; $66.4B list-to-340B gap); HRSA OPAIS covered-entity and contract-pharmacy portal (340bopais.hrsa.gov); CBO Publication 61730 "Growth in the 340B Drug Pricing Program" September 2025 (cbo.gov/publication/61730); GAO-26-108784 "340B Drug Discount Program: Agency Oversight Has Improved, but Actions Needed" October 2025 (gao.gov/products/gao-26-108784); GAO-11-836 (2011), GAO-18-480 (2018), GAO-20-108 (2019) (prior oversight series); Senator Cassidy Senate HELP Committee May 2025 investigation (CVS $382M 2023 CP fees, $3.0B aggregate CP retention estimate; help.senate.gov; Drug Channels May 2025 analysis); AIR340B March 2024 analysis (DSH 340B profit $44.1B vs charity $18.5B, 2022; air340b.org; manufacturer-funded); Conti/Bach 2014 (Health Affairs 33(10):1786-1792, DOI 10.1377/hlthaff.2014.0540); Desai/McWilliams 2018 (NEJM 378(6):539-548, DOI 10.1056/NEJMsa1706475); Health Affairs Scholar 2025 (DOI: qxaf121); Courtemanche 2025 (Journal of Economic Surveys, DOI 10.1111/joes.70076); CMS HCRIS HOSP10 FY2023 (hospital financial data, DSH-hospital panel); IRS Form 990 Schedule H (financial-assistance-at-cost, nonprofit hospital community-benefit reporting); AHA 2022 community-benefit analysis (1,586 tax-exempt 340B hospitals; aha.org); Minn. Stat. Sec. 62J.461 (first state 340B reporting law, first reports April 2024; revisor.mn.gov); Maine 340B transparency law (signed 2024); HRSA 340B Rebate Model Pilot Program (announced August 2025, effective January 1, 2026, 9 drugs per HFMA early-2026 update; hfma.org); American Hospital Association v. Becerra 596 U.S. 724 (2022); CMS-1793-F November 2023 ($10.6B underpayment remedy, $7.8B repayment starting CY2026; federalregister.gov); Third Circuit 2024 ruling (manufacturers not required to ship to unlimited contract pharmacies; hfma.org); Eli Lilly and Company FY2024 Form 10-K and DEF 14A via SEC EDGAR; Walgreens Boots Alliance FY2024 Form 10-K via SEC EDGAR; CVS Health FY2024 Form 10-K and DEF 14A via SEC EDGAR; OpenSecrets.org federal lobbying disclosure database (2020-2024).
Running total after Issue #19: $545.25B / $3.24T (16.8%)
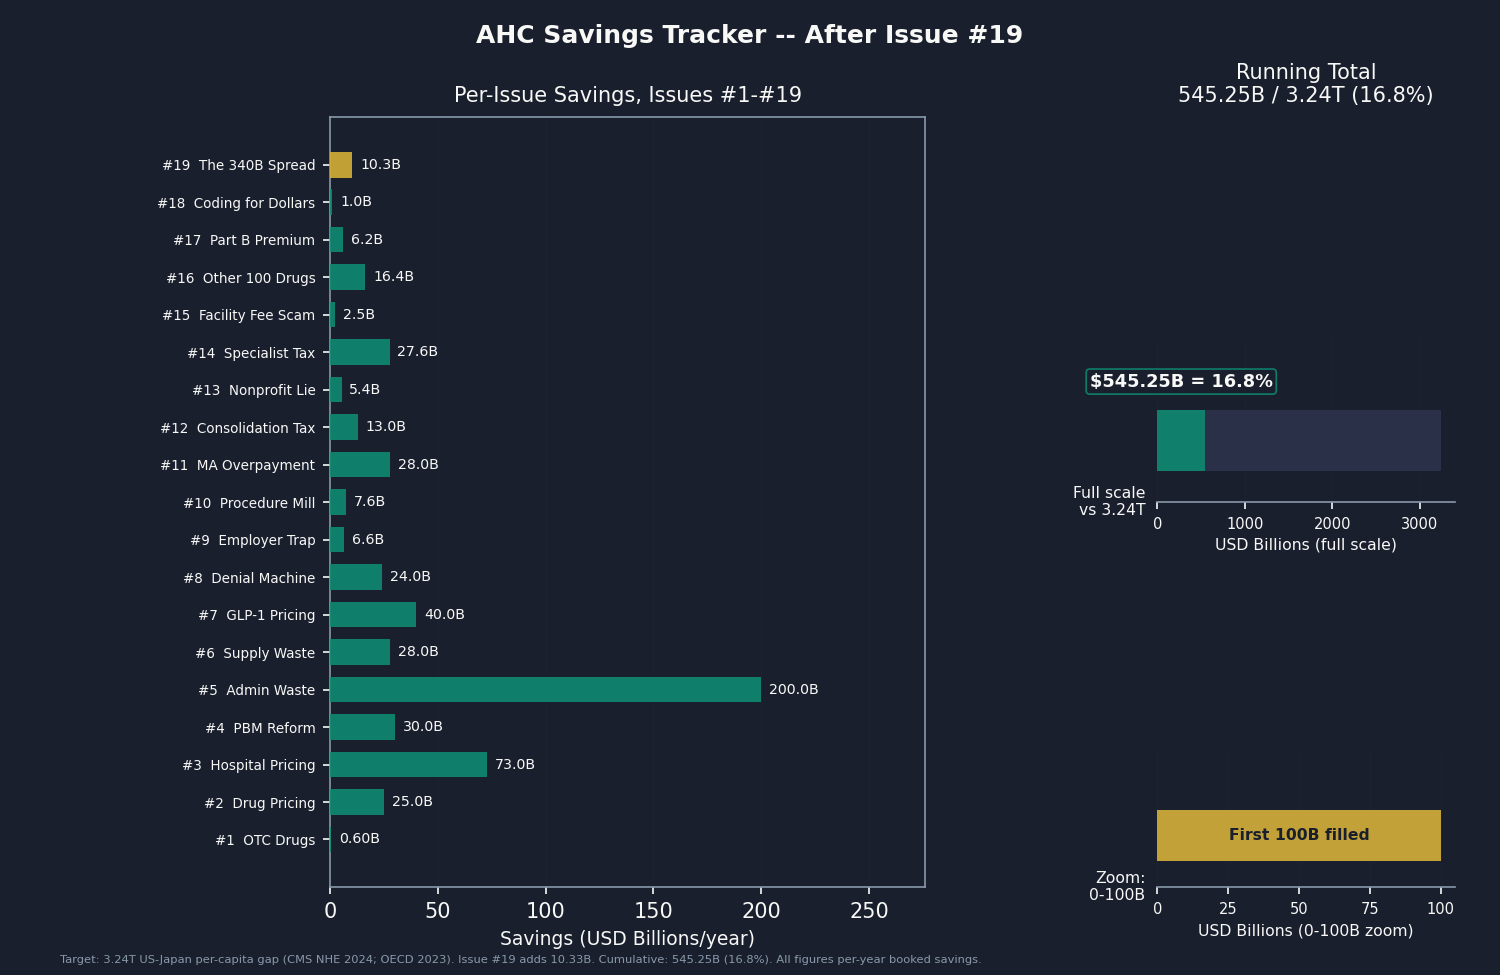
Methodology footnotes: Waterfall: $81.4B in CY2024 program purchases (discounted acquisition price, Drug Channels) x 78% DSH share = $63.49B pool; gross discount on the WAC basis (composite 45% off list, IQVIA $147.8B list value / $66.4B gap) = $51.95B; minus $2.34B in contract-pharmacy fees = $49.61B net spread; minus $16.18B charity care = $34.86B raw gap; minus $9.03B overlap = $25.83B; x 0.40 recoverability = $10.33B booked. Allocation: HRSA publishes no per-entity 340B purchase volumes, so the DSH pool is allocated across the 1,986 short-term acute nonprofit and government hospitals in the universe by bed count; uniform and charity-weighted allocations were also run, and even the adversarial charity-weighted version leaves a positive raw gap ($33.43B), so the direction does not depend on the proxy. Charity measure: Schedule H line 7a financial assistance at cost where a real IRS Form 990 match exists (758 of 1,986 hospitals), HCRIS S-10 charity-care-at-cost for the rest; bad-debt-inclusive uncompensated care is not used. Overlap subtractions (no dollar counted twice): $6.89B with Issue #13 (Nonprofit Lie, direct CCN join), $0.40B with Issue #17 (Part B Pharmacy Premium, which reserved the 340B-acquired Part B share for this issue), $1.74B with Issue #4 (PBM contract-pharmacy fees). Range $1.95B to $26.23B: the floor stacks the most conservative choice on every lever at once (broad community-benefit charity definition, 38% discount, high contract-pharmacy fee, 0.74 DSH share, 0.25 recoverability); the ceiling stacks the most generous choice on each. Denominator: $3.24T US-Japan per-capita spending gap (CMS NHE 2024 final; OECD Health at a Glance 2025). Full methodology, code, and the per-hospital panel are at github.com/rexrodeo/american-healthcare-conundrum.
The American Healthcare Conundrum publishes when the data is ready. All analysis uses publicly available data. Code is open-source. Figures are validated before publication.
Get every issue in your inbox
The American Healthcare Conundrum is free. One fixable problem in U.S. healthcare, with the data, every week.