Issue #18: Coding for Dollars
How hospital documentation programs shift Medicare discharges into higher-paying severity tiers, and the 1 billion dollars per year a faster recalibration cycle could recover
Each issue of The American Healthcare Conundrum identifies one fixable problem in U.S. healthcare spending, builds the data case, and recommends a specific policy fix. All analysis uses publicly available data. Code is open-source.
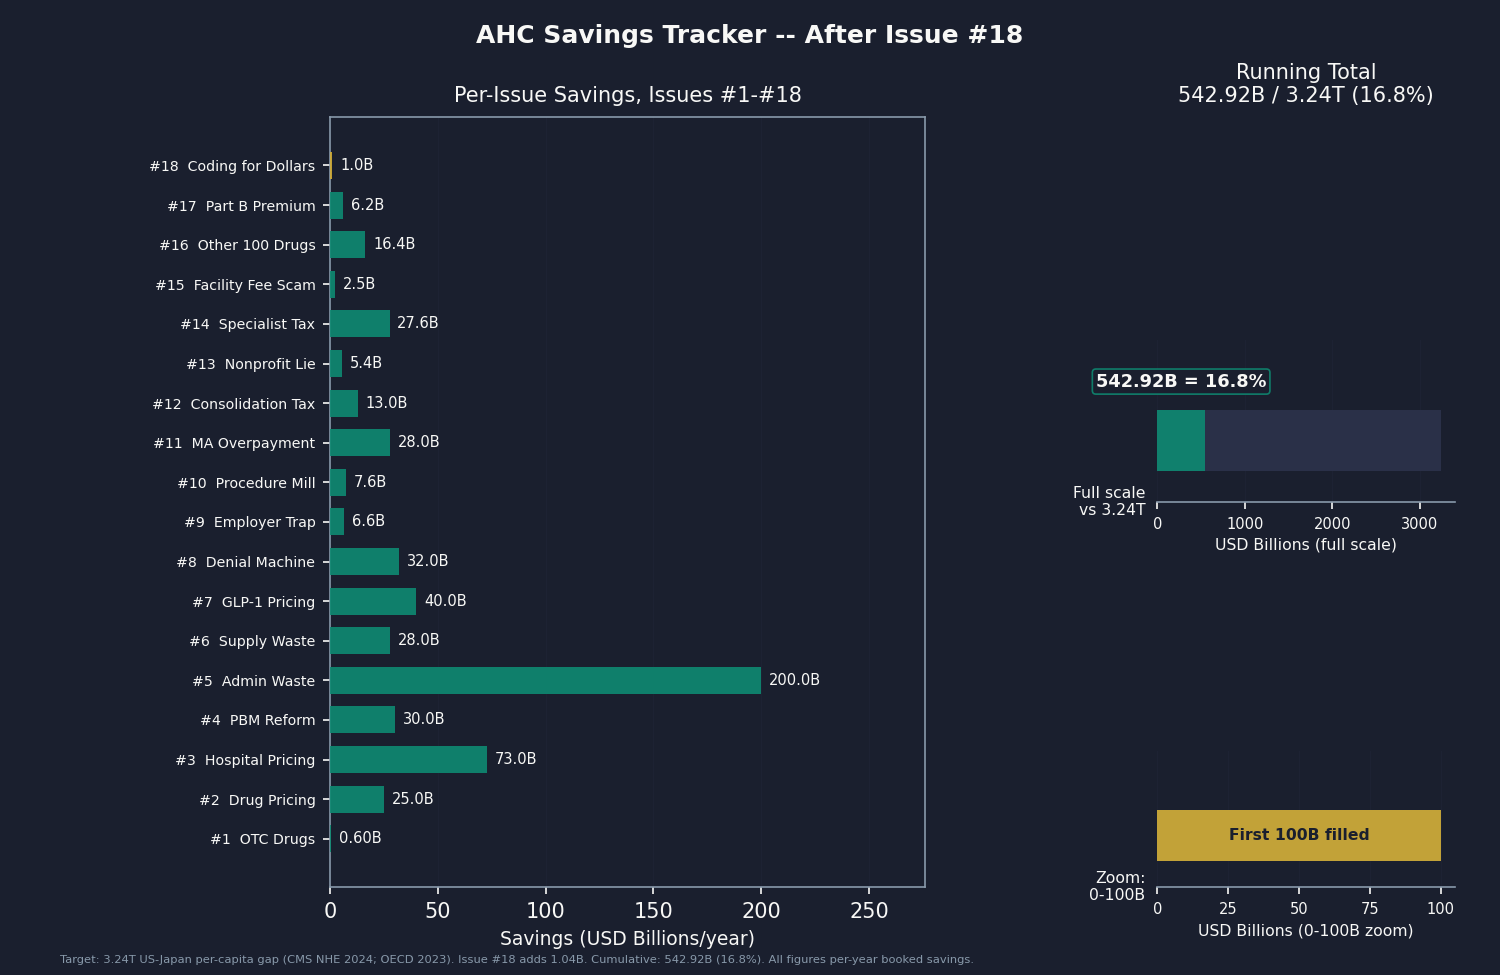
Target: ~$3.24T US-Japan per-capita spending gap
(Japan: highest life expectancy, lowest infant
 mortality in OECD, ~half US per-capita spend)

Full scale: $0 ─────────────────────────── $3.24T
            █████░░░░░░░░░░░░░░░░░░░░░░░░  16.8%
            ↑ $542.92B identified

Per-issue savings (1 block ≈ $8B; max bar = $200B):
 #1 ▏                          $0.6B   OTC Drug Overspending
 #2 ███                       $25.0B   Drug Pricing
 #3 █████████                 $73.0B   Hospital Pricing
 #4 ████                      $30.0B   PBM Reform
 #5 █████████████████████████ $200.0B  Admin Waste
 #6 ███                       $28.0B   Supply Waste
 #7 █████                     $40.0B   GLP-1 Pricing
 #8 ████                      $32.0B   Denial Machine
 #9 █                          $6.6B   Employer Trap
#10 █                          $7.6B   Procedure Mill
#11 ████                      $28.0B   MA Overpayment
#12 ██                        $13.0B   Consolidation Tax
#13 █                          $5.4B   Nonprofit Lie
#14 ████                      $27.6B   Specialist Tax
#15 ▏                          $2.6B   Facility Fee Scam
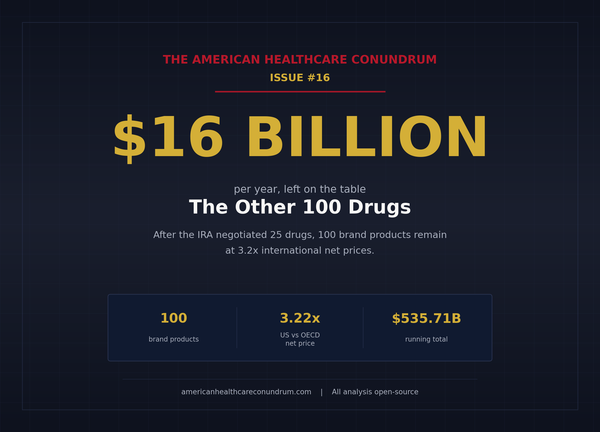
#16 ██                        $16.4B   The Other 100 Drugs
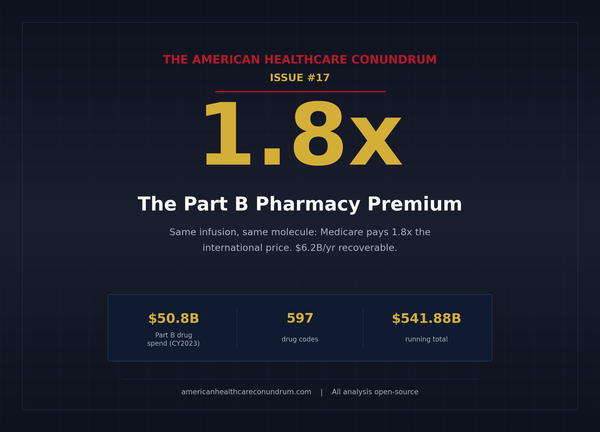
#17 █                          $6.2B   Part B Pharmacy Premium
#18 ▏                          $1.0B   Coding for Dollars (this issue)
   ──────────────────────────────────────────────────
   Total: $542.92B  ·  $2,697.08B remaining
   Scale: $3.24T (CMS NHE 2024; Japan OECD 2023)
A patient arrives at a US hospital with heart failure. The attending physician documents the visit. A certified coding professional reads the notes and assigns diagnosis codes. Software sorts those codes into one of about 770 payment buckets. Medicare pays whatever the bucket is worth.
There are three buckets for heart failure, each a Medicare Severity Diagnosis-Related Group (MS-DRG). MS-DRG 293 covers a stay with no significant complications. MS-DRG 292 covers the same condition with a complication or comorbidity (CC). MS-DRG 291 covers it with a major complication or comorbidity (MCC). The clinical reality can be identical in all three. What differs is what the medical record says. MS-DRG 291 pays substantially more than 293.
That price gap creates an incentive. Document an elevated creatinine, and the stay moves from 293 to 292 (acute kidney injury added as a CC). Document acute respiratory failure alongside the heart failure, and it moves to 291. The clinical facts may or may not support those additions. The incentive is there either way, and it operates across every condition family in the Medicare inpatient system.
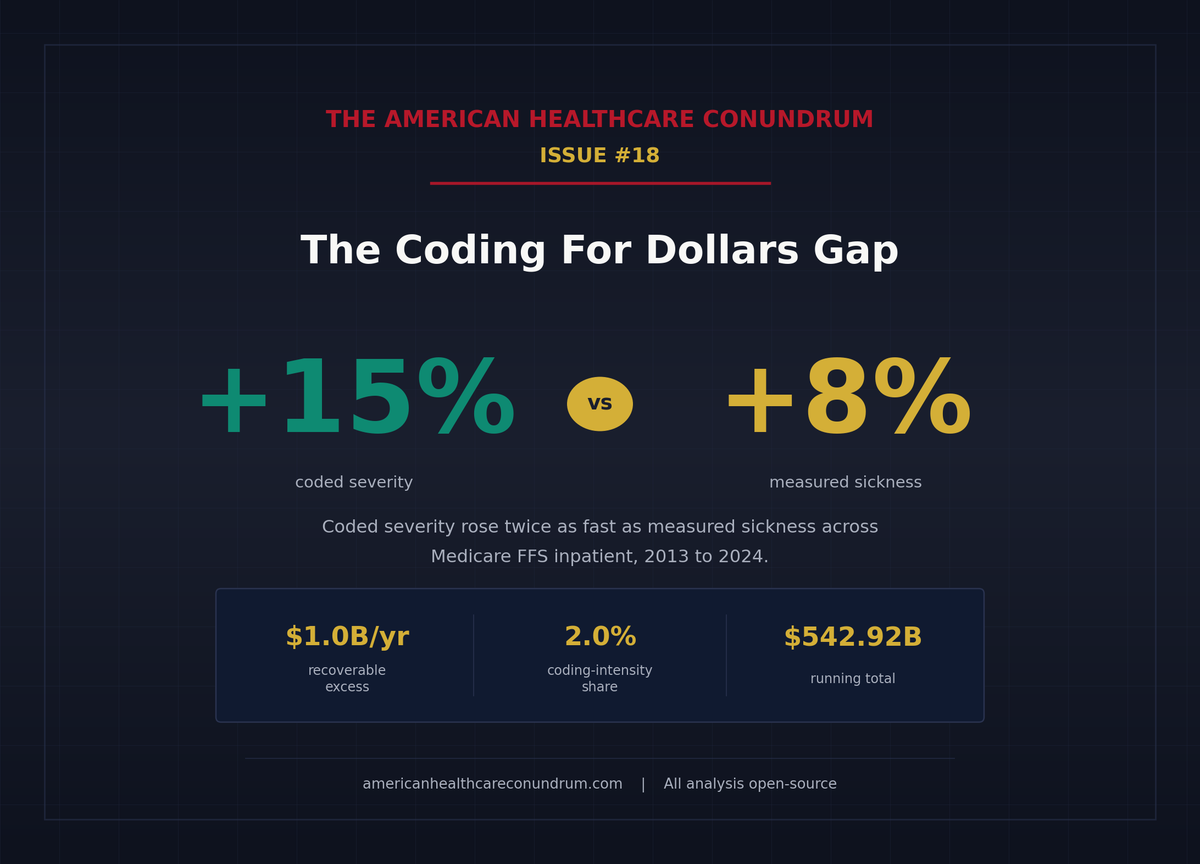
Across all Medicare inpatient stays, coded severity rose about 15 percent from 2013 to 2024 (using a price-held-constant Fisher index). Patients' independently-measured sickness, tracked separately through a different scoring system, rose about 8 percent. The best published patient-level estimate of how much of that gap reflects coding intensity rather than genuine clinical complexity is about 2 percent of the Medicare inpatient payment pool, amounting to roughly $1.0 billion per year in recoverable payments. A cruder but independent method puts the ceiling at about $5 billion. The range is wide. That width is, itself, a policy problem.
The Signal
Coded Severity vs. Measured Sickness
To build the coded-severity figure, this analysis holds Diagnosis-Related Group (DRG) prices constant at their 2024 values and re-weights each year's national Medicare discharge mix, so what changes is only the mix itself. That fixed-weight index, computed as a symmetric average of base-year and end-year anchors, rose 15.5 percent from 2013 to 2024. The Centers for Medicare and Medicaid Services (CMS) separately scores how sick each beneficiary actually is, through the Hierarchical Condition Category (HCC) risk-adjustment model, using each patient's diagnoses across the full year. That fee-for-service (FFS) risk score rose 7.8 percent over the same window. Coded severity climbed twice as fast as measured sickness.
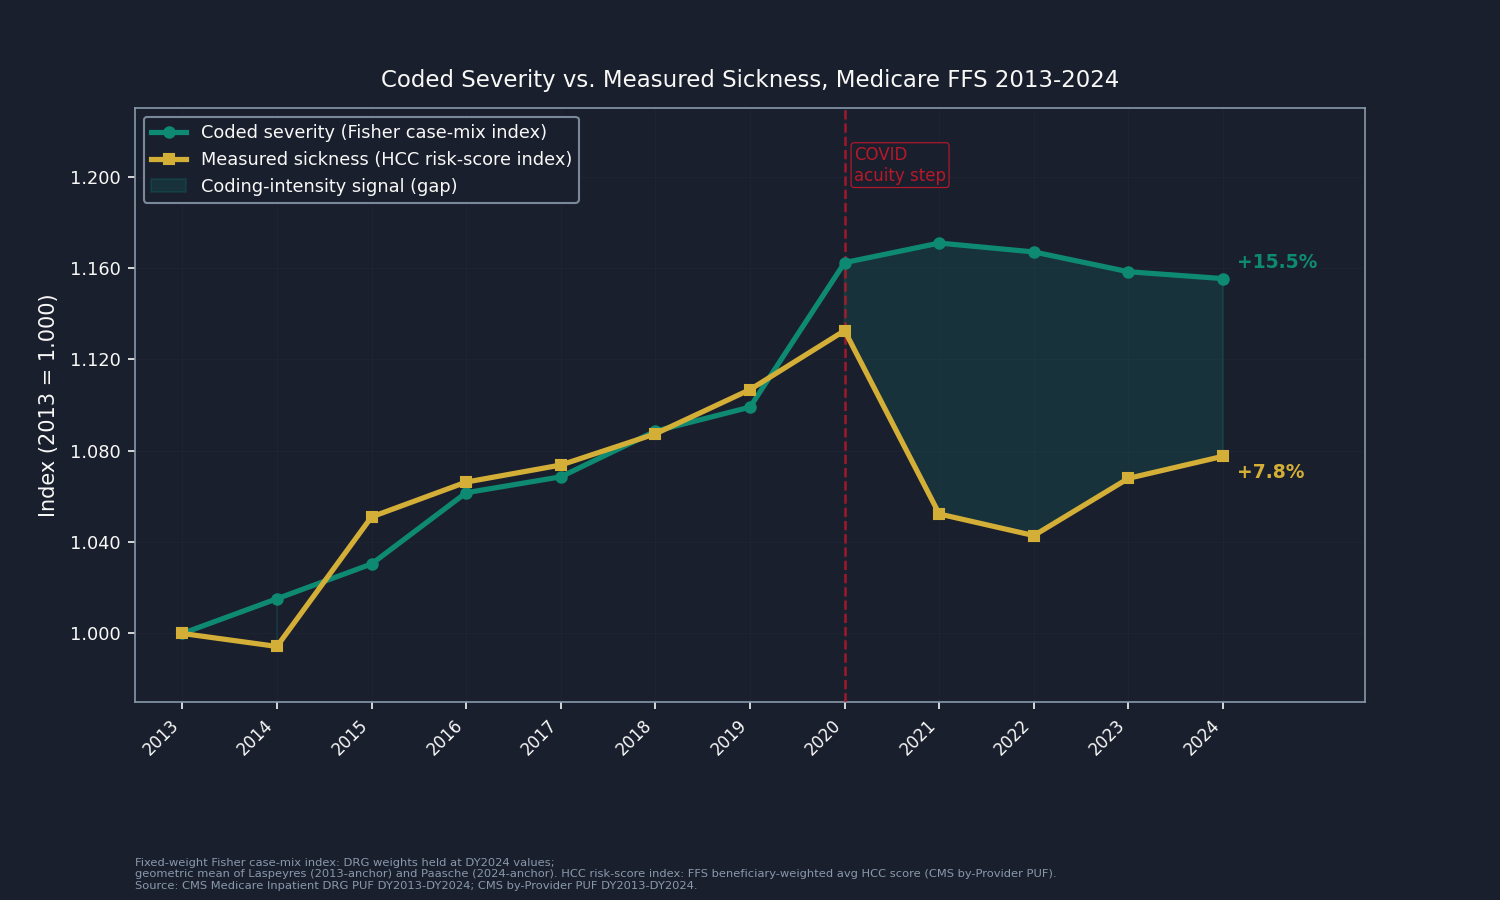
The 2020 data jumps sharply: COVID-19 respiratory failure and sepsis were genuinely severe. The pre-COVID slope (2013 to 2019: +9.9 percent) is the clean signal, and the booked figure below rests on that pre-pandemic window, not on the post-2020 plateau.
Why Budget-Neutrality Does Not Erase This
Every year CMS recalibrates the DRG weight schedule so the average stay costs roughly the same: if one weight goes up, others adjust down. But that rebalancing applies to the weights, not to how many stays land in which weight tier. When more discharges migrate into higher-weight DRGs, total Medicare inpatient payments rise regardless. The only tool that claws that back is a separate instrument, the documentation-and-coding adjustment, which Congress last used in force on the fiscal year 2008 MS-DRG transition (recouping about $11 billion by FY2017, American Taxpayer Relief Act of 2012, Section 631). No standing annual reduction since has caught the 2013-to-2024 migration. It is real money, not an accounting artifact.
Mechanism in Concrete Terms
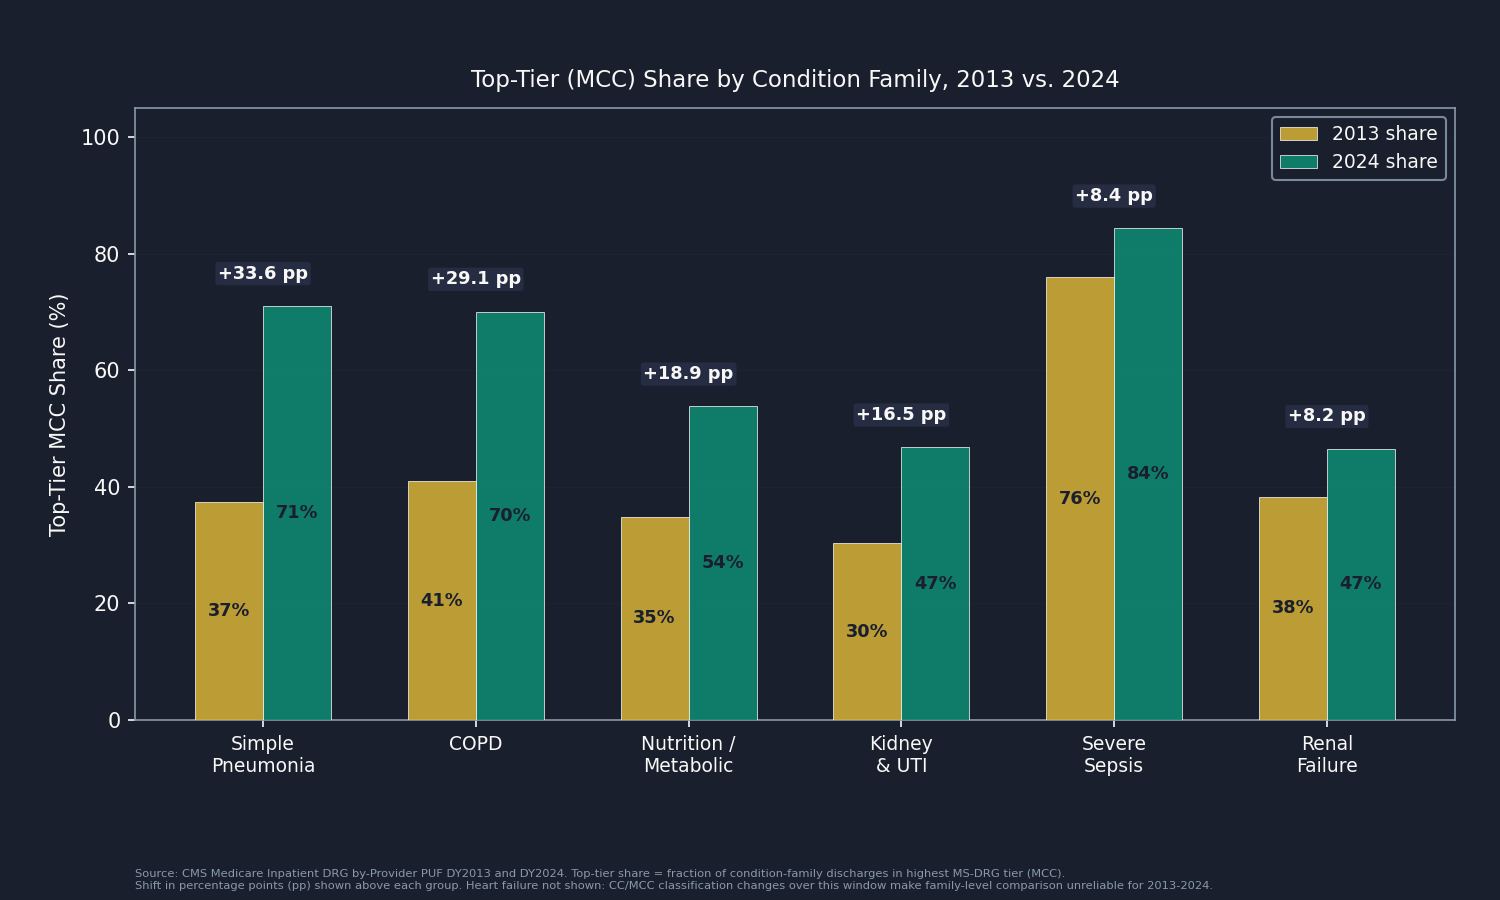
The condition families show where the migration comes from. Severe sepsis with major complication (MS-DRG 871) rose from 76.0 percent of all sepsis discharges in 2013 to 84.3 percent in 2024, an 8.4-point shift; the pay gap between the top and bottom sepsis tier is roughly $7,825 per discharge. Simple pneumonia with MCC (MS-DRG 193) rose from 37.4 percent to 71.0 percent of pneumonia discharges. Across eight families, the within-family shift toward the top tier represents about $1.7 billion in migration value. That illustrates where the drift sits; it does not add to the headline, which is computed differently. (Heart failure is excluded from the family panel because CMS also changed the CC/MCC classification list over the window, making it hard to separate coding behavior from regulatory redefinition.)
The industry built a business around capturing these tier migrations. Clinical documentation improvement (CDI) programs are a dedicated hospital function whose job is to ensure every CC and MCC the patient has is documented. CDI software vendors pitch their products by projecting DRG migration revenue. This is not fraud in most cases. It is a rational, legal response to a payment design that rewards complete documentation.
The Dollars
From Gap to Recoverable Estimate
Crespin et al. 2024 in Health Affairs analyzed five states from 2011 to 2019, controlling for patient demographics, length of stay, principal diagnosis, hospital characteristics, and comorbidity scores. With those patient-level controls in place, coding intensity accounted for 2.0 percent of Medicare MS-DRG payment weights (95% CI: 1.7 to 2.2 percent). It gives each patient credit for their measured clinical complexity and isolates only the coding residual that survives those controls.
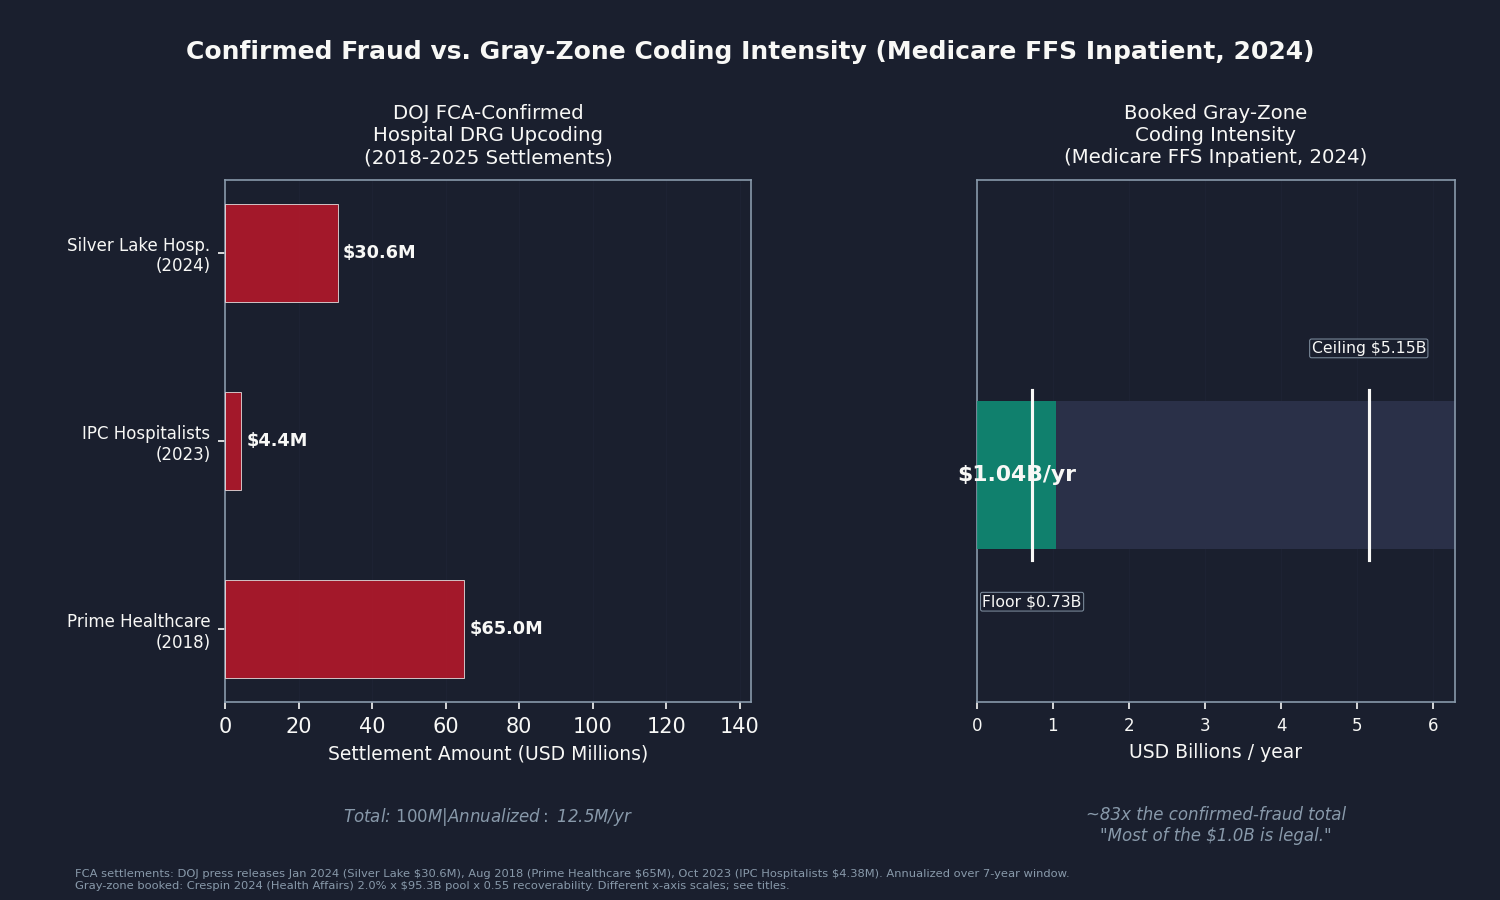
The FFS Medicare Inpatient Prospective Payment System (IPPS) pool for DY2024, adjusted to remove non-scaling add-ons (outlier payments and capital, which are charge-driven and DRG-weight-neutral), is $95.3 billion. Applying Crespin's 2.0 percent to that pool yields $1.9 billion gross. At a 0.55 recoverability factor (conceding that 45 percent of coded severity reflects genuine documentation that any audit would preserve), the booked central is $1.04 billion. After netting $3 million for the Department of Justice (DOJ) False Claims Act (FCA) confirmed-fraud overlap (three settled hospital DRG-upcoding cases from 2018 to 2025, $100 million total), the booked figure rounds to $1.04 billion.
Booked central: $1.04 billion per year. Range: $0.73 billion to $5.15 billion.
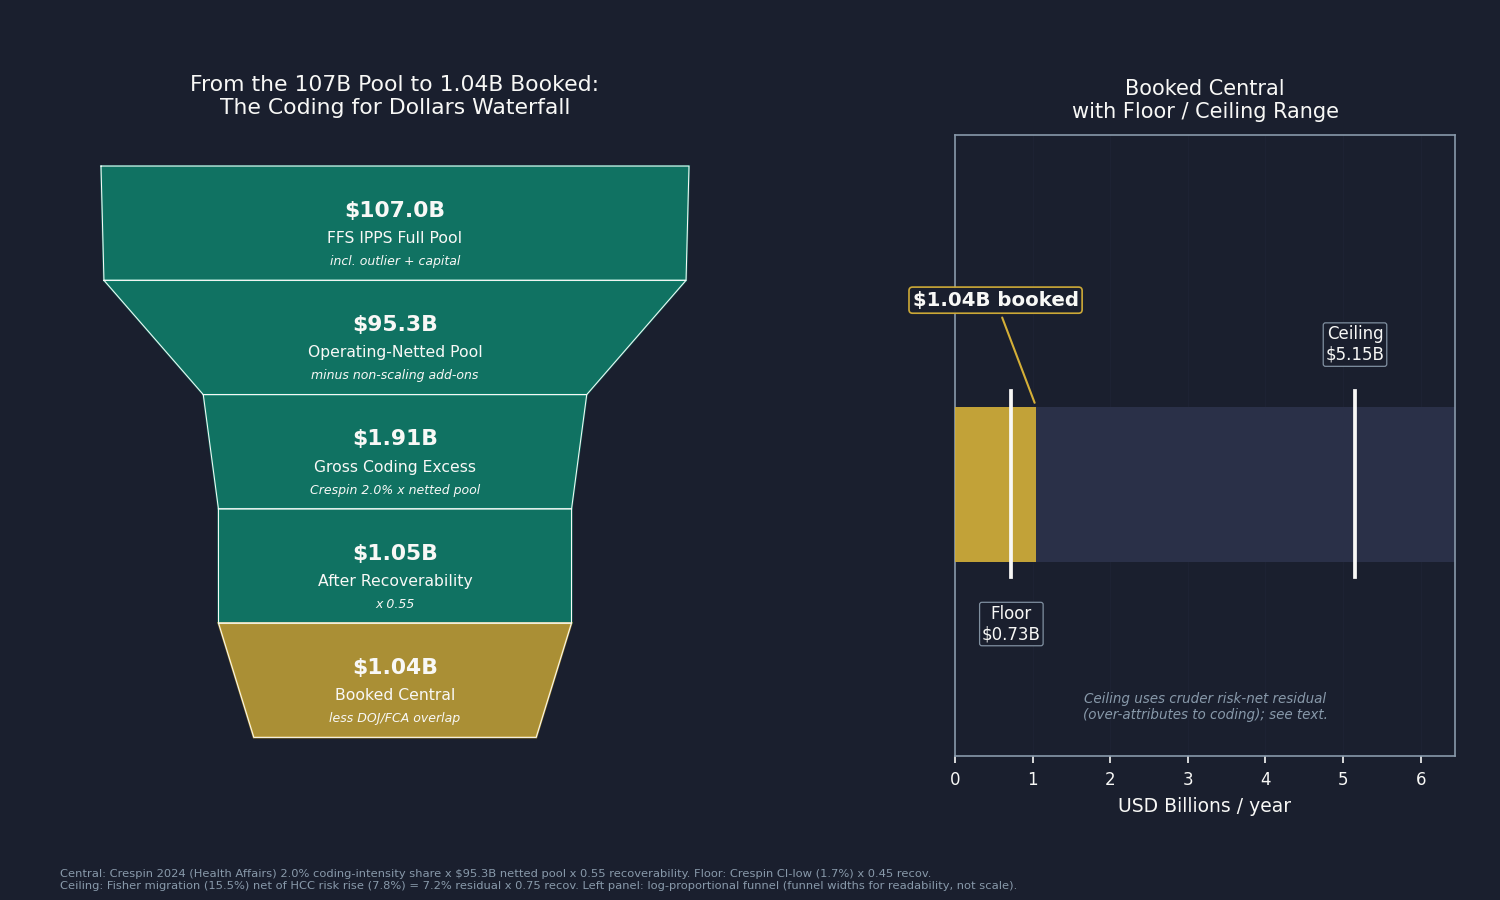
The floor ($0.73 billion) uses Crespin's lower confidence bound: 1.7 percent times the operating-netted pool at a 0.45 recoverability factor.
The ceiling ($5.15 billion) uses a cruder method: take the Fisher migration index (+15.5 percent), divide out the HCC risk-score rise (+7.8 percent), and value the 7.2 percent residual at a 0.75 recoverability factor. The problem is that the HCC score is itself partly built from the same diagnosis codes that drive DRG assignment, so netting one coding-contaminated series by another over-removes genuine acuity and over-attributes the remainder to gaming. It is the upper bound, not the central. The gap between the two methods reflects how much the evidence still leaves open; a national patient-level replication of Crespin's methodology would narrow it.
Is It Really Coding?
The Selection Counter
The single strongest objection is compositional. Over 2013 to 2024, Medicare Advantage (MA) enrollment roughly doubled: the FFS share of all Medicare beneficiaries fell from 71.8 percent to 49.9 percent (CMS Medicare enrollment public files). If the beneficiaries who left FFS for MA were healthier than average, the patients remaining in FFS would be sicker on average, and coded severity would rise even without any change in coding behavior.
There are three responses. First, Crespin's regression controlled for demographics, length of stay, comorbidities, and hospital fixed effects, so selection-driven acuity shifts are absorbed at the patient level. Second, any selection making the remaining FFS pool genuinely sicker would show up in HCC risk scores, and the ceiling method divides that out. Third, the FFS average HCC risk score actually fell 2.6 percent from 2019 to 2024 (model recalibration plus COVID-era mortality among the frailest), so selection did not inflate measured FFS acuity over the years the Crespin share is carried forward.
Patients Really Are Sicker
A second objection is that patients are genuinely older and more complex; FFS beneficiary age rose from 73.2 to 75.6 years over the window. That is true, and the booked figure already gives it full credit: the HCC risk score captures measured acuity, and the 7.8 percent rise is netted out before anything is booked. A third objection is that CMS periodically revises the MS-DRG definitions and CC/MCC severity lists. The aggregate index absorbs those changes by holding the 2024 weight vector constant across all years, so a definitional reclassification washes out. What remains is what the record says that the patient's independently-scored health status does not.
Who Profits
The documentation-as-revenue-strategy industry spans hospitals, their clinical documentation improvement programs, and the vendors who power those programs.
HCA Healthcare (HCA) FY2024 Revenue: $70.6B | Operating Margin: ~12% | CEO Comp (Sam Hazen): ~$24M | Stock Buybacks (2020-24): ~$14B | Lobbying (2020-24): ~$28M This issue's mechanism: HCA operates 190 hospitals and is the largest for-profit chain in the United States. Silverman and Skinner (Journal of Health Economics, 2004) documented that for-profit hospitals showed DRG upcoding shifts roughly twice as large as nonprofits, with hospitals converting to for-profit showing the largest shifts. Investor return requirements create a structural incentive to maximize coded severity across every encounter. HCA also appears in Issue #3: The 254% Problem, Issue #12: The Consolidation Tax, and Issue #14: The Specialist Tax.
Community Health Systems (CYH) FY2024 Revenue: $12.6B | Operating Margin: 4.3% | CEO Comp (Tim Hingtgen): ~$7.6M This issue's mechanism: Community Health Systems operates primarily in non-urban markets and carries significant debt from its 2014 acquisition of Health Management Associates. Financial stress concentrates the incentive to maximize coded severity: CDI programs that improve case-mix index directly improve operating cash flow, and CYH has disclosed case-mix index improvement as a revenue growth driver in its annual reports and earnings calls.
Solventum (SOLV) / 3M Health Information Systems FY2024 Revenue: $8.25B | Health Information Systems Segment: ~$1.3B (15.8% of net sales) | Operating Margin: 12.6% | CEO Comp (Bryan Hanson): $40.0M (includes a one-time $29.6M spinoff make-whole equity grant) This issue's mechanism: Solventum, spun out of 3M in April 2024, owns two products at the center of the DRG coding system. First, 360 Encompass, the leading CDI software that prompts physicians toward more complete documentation of CCs and MCCs; hospitals buy it because the return on investment is measured in DRG migration revenue. Second, Solventum owns and licenses the GROUPER software itself, the same code CMS uses to assign MS-DRGs. A company that profits from documentation-intensity improvements and also maintains the payment-bucket assignment software has no incentive to make those buckets harder to optimize.
Sources: HCA Healthcare, Community Health Systems, and Solventum FY2024 Form 10-K and DEF 14A filings via SEC EDGAR; Solventum CIK 0001964738 (spun from 3M, first full fiscal year 2024); Silverman/Skinner 2004 (Journal of Health Economics 23(2):369-389); OpenSecrets.org federal lobbying disclosure database (2020-2024).
The Fix
The correction mechanism described earlier is real but undersized, and the 0.55 recoverability factor already concedes that 45 percent of coded severity is legitimate and would survive any audit. Three levers address what remains.
Lever 1 (prospective rate-rebasing): Shorten the documentation-and-coding adjustment cycle. The discharge data informing CMS's annual adjustment can be two to three fiscal years old when the IPPS Final Rule takes effect each October 1. Using more recent data, or applying a provisional reduction pending final data, would shrink the window in which coding intensity runs ahead of the adjustment. This is a CMS rulemaking action; it does not require Congressional authorization.
Lever 2 (targeted audit authority): Expand Office of Inspector General (OIG) audit coverage for high-yield DRG pairs. The Department of Health and Human Services (HHS) OIG added a fiscal year 2025 work plan item targeting sepsis billing after MS-DRG 871 reached $7.4 billion in fiscal year 2019 payments. The same approach, applied to pneumonia, COPD, malnutrition, and encephalopathy, would cover the families where tier migration is largest. Prospective rate-rebasing is better suited than the Recovery Audit Contractor (RAC) program's after-the-fact clawbacks, which historically created cash-flow disputes.
Lever 3 (structural): Payment models that remove the incentive entirely. Bundled payment programs and ACO REACH models pay a fixed amount for an episode or a population, removing the per-discharge severity incentive. CMS Center for Medicare and Medicaid Innovation (CMMI) has run these models for years, but voluntary uptake has not reached the volume needed to close the gap. This is the long-run lever.
Who acts: CMS for Lever 1, HHS OIG and Congress for Lever 2, CMMI and Congress for Lever 3. Issue #11: The MA Overpayment booked $28 billion on the insurer-side surface of the same root mechanism, Medicare Advantage plans coded as sicker. This issue's FFS hospital side is a different program, different actors, and zero dollar overlap: same cause, different flow.
What's Next
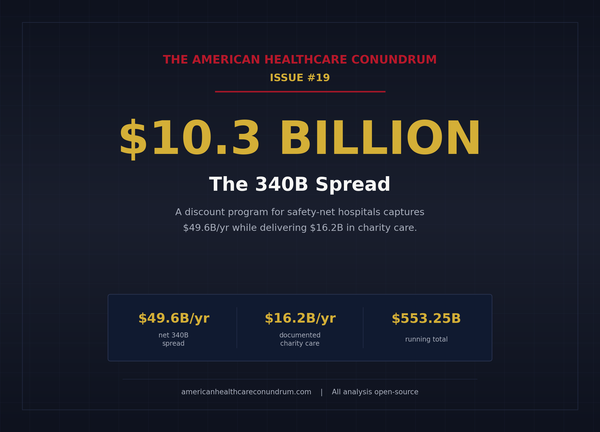
Issue #19: The 340B Spread publishes July 5. The 340B Drug Pricing Program lets covered entities buy outpatient drugs at 25 to 50 percent below average wholesale price, then bill Medicare and commercial payers at the full price and keep the spread. Created in 1992 to help safety-net providers serve uninsured patients, it has since expanded to more than 50,000 contract pharmacies and 12,000 covered entities. Issue #19 joins Health Resources and Services Administration (HRSA) registration data to Medicare Part B drug spending, isolates the charity-care share from the spread flowing elsewhere, and books the recoverable portion. The fix ties the discount to documented charity-care delivery.
The gap between the controlled central ($1.0B) and the cruder ceiling ($5.2B) can be narrowed by a national patient-level replication of Crespin's regression: the HCUP National Inpatient Sample (NIS) or State Inpatient Databases (SID) under a data use agreement, or CMS Limited Data Set/Virtual Research Data Center claim-level files. With those, the central estimate moves from a published five-state share applied to the national pool to a directly computed national gap. Organizations holding licensed discharge microdata or active data use agreements: reach us at contact@ahcdata.fund or ahcdata.fund.
Worked inside the system? We talk with people who have seen hospital clinical documentation improvement programs, inpatient medical coding, hospital revenue cycle operations, or DRG and case-mix audit work from the inside. If you can help us understand how these processes actually work, or point us to documentation that does, we would value a conversation, on background and in confidence. Reach us at contact@ahcdata.fund.
All analysis code is at github.com/rexrodeo/american-healthcare-conundrum. If the math looks wrong, say so.
If this issue was useful, forward it to someone who works in or pays for a hospital stay, which is most of us eventually.
[Subscribe to The American Healthcare Conundrum]
Sources: CMS Medicare Inpatient Prospective Payment System Geographic Variation Public Use File and by-Provider Public Use File, DY2013-DY2024 (data.cms.gov); CMS FY2026 IPPS Final Rule (CMS-1833-F, Fed Reg Aug 4, 2025; standardized operating amount $6,752.61; 770 payable MS-DRGs); CMS MS-DRG Classifications and Software, V25-V44 (cms.gov); Crespin/Dworsky et al. 2024 (Health Affairs 43(12):1619-1627, DOI 10.1377/hlthaff.2024.00596; five-state 2011-19 upcoding, $14.6B all-payer 2019, 2.0% Medicare coding-intensity share of MS-DRG weights, CI 1.7-2.2%); Silverman/Skinner 2004 (Journal of Health Economics 23(2):369-389; for-profit upcoding gradient); Geruso/Layton 2020 (Journal of Political Economy 128(3):984-1026, DOI 10.1086/704756; MA risk-score upcoding 6-16%); HHS OIG FY2025 Work Plan, sepsis billing item (added March 2024; MS-DRG 871 $7.4B FY2019); HHS OIG, "Hospitals Billed Medicare for More Complex Inpatient Cases" 2020 (OEI-02-16-00570); DOJ FCA hospital DRG-upcoding settlements: Silver Lake Hospital Jan 2024 ($30.6M, justice.gov), Prime Healthcare Aug 2018 ($65M), IPC Hospitalists Oct 2023 ($4.38M); MedPAC March 2026 Report (FFS IPPS spending ~$110-125B; documentation-and-coding adjustment history); American Taxpayer Relief Act of 2012 (ATRA) Section 631 (documentation-and-coding recoupment; ~$11B FY2008-2012 transition coding, completed ~FY2017); CMS MA enrollment public files DY2013-DY2024 (FFS share 71.8% to 49.9%); HCA Healthcare FY2024 Form 10-K and DEF 14A via SEC EDGAR; Community Health Systems FY2024 Form 10-K and DEF 14A via SEC EDGAR; Solventum FY2024 Form 10-K and DEF 14A via SEC EDGAR (CIK 0001964738); OpenSecrets.org federal lobbying disclosure database (2020-2024).
Running total after Issue #18: $542.92B / $3.24T (16.8%)
Methodology footnotes: Case-mix migration: national fixed-weight index computed from CMS Medicare Inpatient DRG Public Use File national rows, DY2013-DY2024; each DRG's relative weight held at DY2024 national average Medicare payment value. Fisher index (geometric mean of Laspeyres 2013-anchor and Paasche 2024-anchor): +15.53% over 2013-2024, +9.91% over 2013-2019 (pre-COVID clean slope). Paasche (2024-anchor only) = +18.87%; Laspeyres (2013-anchor only) = +12.29%; full band disclosed in drg_complexity_trend.csv. Acuity counterfactual: FFS beneficiary-weighted average HCC risk score from CMS by-Provider PUF, DY2013-DY2024; rose +7.8%. The HCC risk score is itself partially coding-driven (diagnoses used for risk adjustment overlap with diagnoses that affect DRG assignment), so the ceiling method that uses the risk score as a control over-attributes the residual to coding; this is why it is labeled the ceiling, not the floor or central. FFS IPPS pool: sum of national DRG rows (discharges x average Medicare payment per discharge) = $107.04B for DY2024 (full, incl. add-ons); MedPAC cross-check $110-125B (PUF excludes DRGs with fewer than 11 discharges by design). Operating-netted pool: $107.04B minus non-scaling add-ons (outlier payments ~5.1% + capital ~5.9% of operating base = 11% haircut) = $95.27B. IME and DSH are proportional add-ons that scale with the DRG-adjusted operating base and are correctly retained in the pool. MA enrollment: FFS share fell from 71.8% (DY2013) to 49.9% (DY2024), MA from 28.2% to 50.1%. Central method: Crespin 2024 Medicare coding-intensity share (2.0% of payment weights, fully patient-level-controlled, Exhibit 4) x $95.27B operating-netted DY2024 FFS IPPS pool = $1.91B gross. The Crespin figure is national (Discussion cites CMS National Health Expenditure data and cross-validates against MedPAC's national MA figure); the 2.0% share is applied to the current-year pool without further population scaling. Recoverability: 0.55 central (range 0.45 to 0.75). Floor: Crespin CI-low (1.7%) x $95.27B x 0.45 = $0.73B. Ceiling: Fisher risk-net residual 7.22% x $95.27B x 0.75 = $5.15B. Overlap subtractions: Issue #11 MA coding intensity = zero (MA insurer-side risk-adjustment, different program); Issue #5 admin cost = zero (compliance cost vs. coding revenue, sequential layers); Issue #15 facility fee = zero (outpatient HCPCS vs. inpatient MS-DRG, different settings); Issue #10 Procedure Mill = additive (overuse changes what is done; coding intensity changes how what is done is reported); Issue #24 confirmed fraud = 25% x $12.5M annualized FCA-confirmed hospital DRG settlements = $3.1M (negligible). Booked: $1.91B x 0.55 minus $3.1M overlap = $1.045B, rounded to $1.04B. Mechanism decomposition: eight condition families, total constant-volume tier-migration value $1.7B; this is within the residual, not additive. COVID: 2020 case-mix step reflects genuine COVID acuity; central anchors to Crespin's 2019 pre-COVID, patient-level-controlled coding-behavior share and is COVID-clean by construction. Denominator: $3.24T US-Japan per-capita gap (CMS NHE 2024 final, OECD Health at a Glance 2025).
Cumulative after Issue #17: $541.88B. Issue #18 adds $1.045B. New cumulative: $542.92B. Percentage: 542.92 / 3,240 = 16.8%.
The American Healthcare Conundrum publishes when the data is ready. All analysis uses publicly available data. Code is open-source. Figures are validated before publication.
Get every issue in your inbox
The American Healthcare Conundrum is free. One fixable problem in U.S. healthcare, with the data, every week.