Issue #15: The Facility Fee Scam
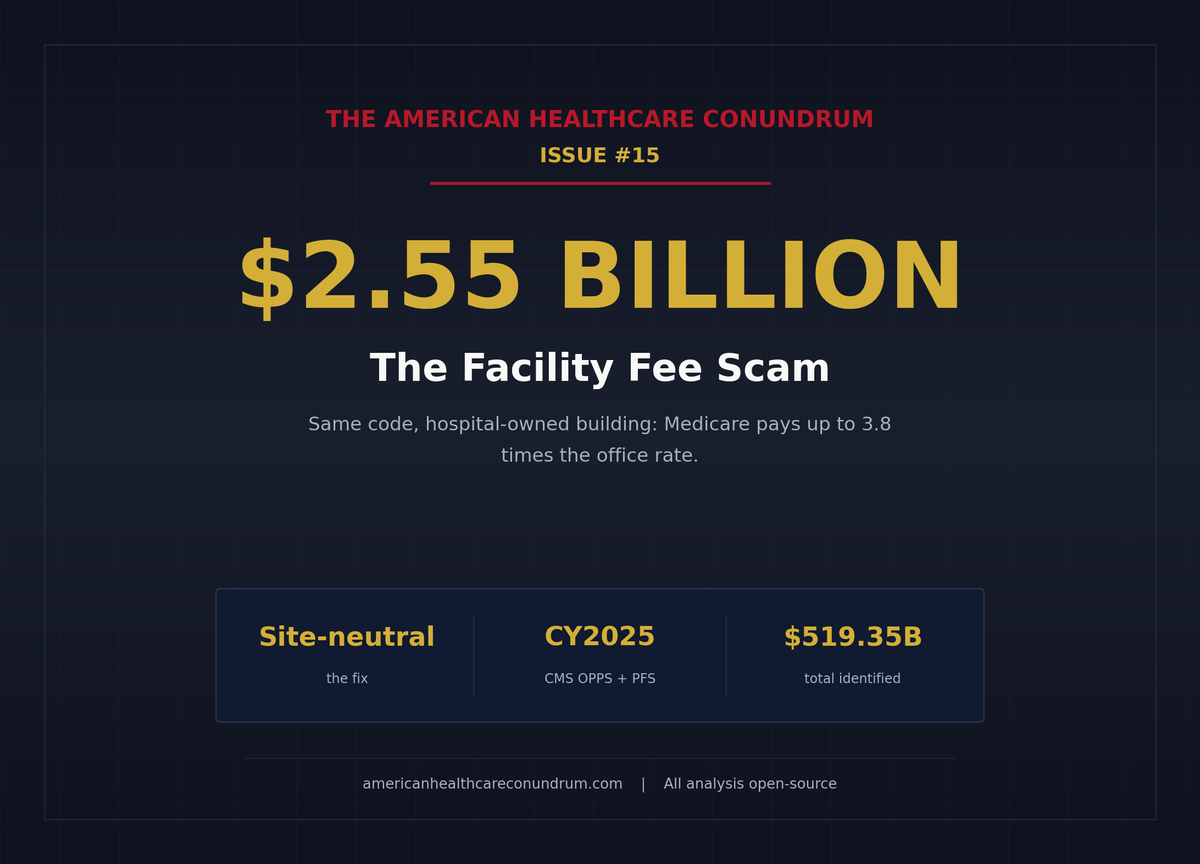
How hospital-owned clinics bill Medicare two to four times the office rate for the same procedure, and the $2.55 billion a year a site-neutral fix would recover
Each issue of The American Healthcare Conundrum identifies one fixable problem in U.S. healthcare spending, builds the data case, and recommends a specific policy fix. All analysis uses publicly available data. Code is open-source.
Target: ~$3.24T US-Japan per-capita spending gap
(Japan: highest life expectancy, lowest infant
 mortality in OECD, ~half US per-capita spend)

Full scale: $0 ─────────────────────────── $3.24T
            █████░░░░░░░░░░░░░░░░░░░░░░░░  16.0%
            ↑ $519.35B identified

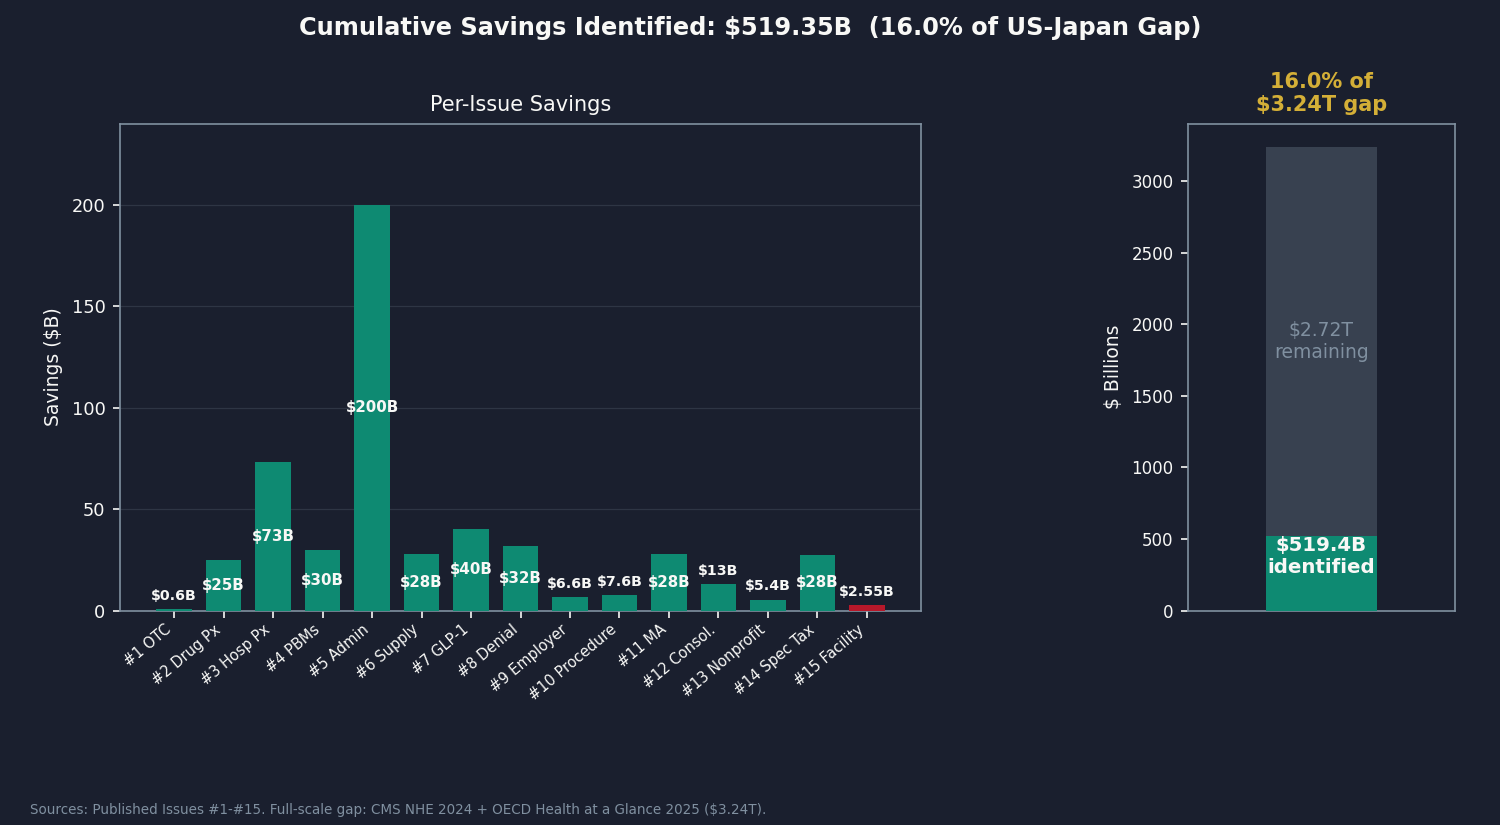
Per-issue savings (1 block ≈ $8B; max bar = $200B):
 #1 ▏                          $0.6B   OTC Drug Overspending
 #2 ███                       $25.0B   Drug Pricing
 #3 █████████                 $73.0B   Hospital Pricing
 #4 ████                      $30.0B   PBM Reform
 #5 █████████████████████████ $200.0B  Admin Waste
 #6 ███                       $28.0B   Supply Waste
 #7 █████                     $40.0B   GLP-1 Pricing
 #8 ████                      $32.0B   Denial Machine
 #9 █                          $6.6B   Employer Trap
#10 █                          $7.6B   Procedure Mill
#11 ████                      $28.0B   MA Overpayment
#12 ██                        $13.0B   Consolidation Tax
#13 █                          $5.4B   Nonprofit Lie
#14 ████                      $27.6B   Specialist Tax
#15 ▏                          $2.55B  Facility Fee Scam (this issue)
   ──────────────────────────────────────────────────
   Total: $519.35B  ·  $2,720.65B remaining
   Scale: $3.24T (CMS NHE 2024; Japan OECD 2023)
Two patients need a chest X-ray. Same image, same radiologist, same billing code. One goes to an independent radiology office. The other goes to a clinic a hospital system bought last year. The acquisition did not change the building, the equipment, or the radiologist. It changed the billing rules.
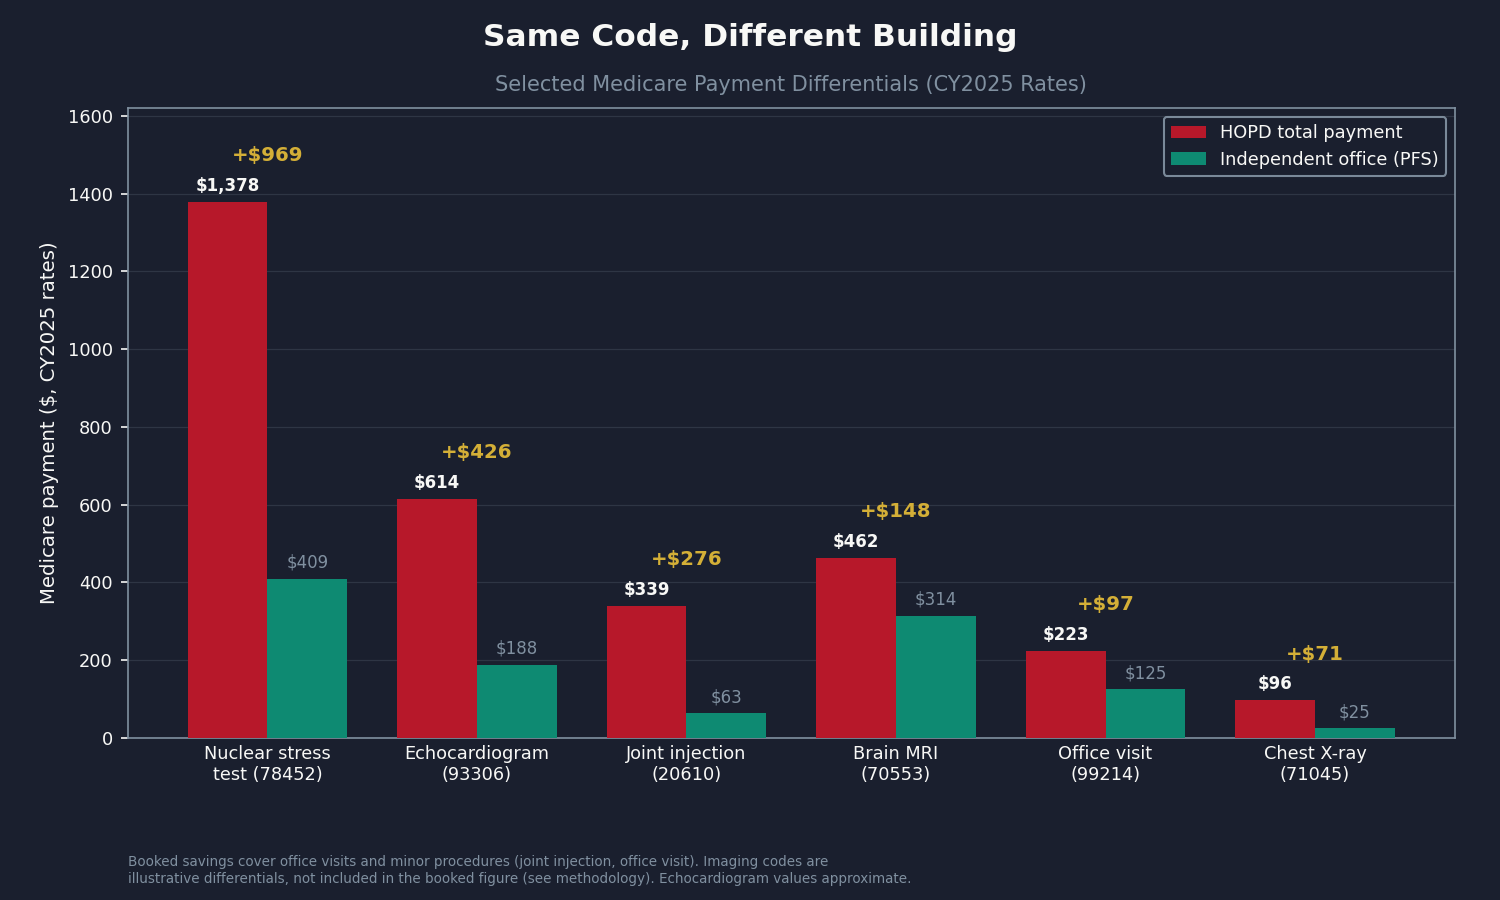
At the independent office, Medicare pays $25.23. At the hospital-owned clinic, Medicare pays $96.46 for the same procedure: a $88.05 facility fee plus an $8.41 professional fee. That is 3.8 times more for an identical study. The chest X-ray is just the clearest illustration. The analysis itself focuses on the categories where public data cleanly supports a number: clinic visits and minor procedures, where hospital-owned offices bill at Hospital Outpatient Department (HOPD) rates for work that is clinically identical to what an independent physician office provides.
Across those two categories, applying current Centers for Medicare and Medicaid Services (CMS) rates to 2023 utilization, the computation produces $1.967 billion per year in Medicare counterfactual savings. Extended conservatively to commercial insurance and netted against overlap with earlier issues, the recoverable figure is $2.55 billion per year (range $0.93B to $4.13B).
The fix has been on the table since 2014. The Medicare Payment Advisory Commission (MedPAC) has recommended site-neutral payment every year for over a decade. Congress passed a partial version in 2015 and left most of the money on the table.
The Two Billing Rules
When a physician treats a Medicare patient in an independent office, Medicare pays one amount, set by the Physician Fee Schedule (PFS). That rate covers both the doctor's work and the office overhead.
When the same physician treats the same patient in a building the hospital owns and has designated as a provider-based clinic, the billing splits in two. The hospital files an institutional claim under the Outpatient Prospective Payment System (OPPS). The physician files a separate professional claim. Medicare pays both, and the combined total runs two to four times the PFS amount. The extra claim is the facility fee, and it flows to the hospital, not the physician.
The trigger is a billing designation called provider-based status (42 C.F.R. Section 413.65). When a hospital acquires a practice and converts it, the same building starts generating two claims per visit instead of one. The OPPS itself was built in 2000 to replace cost-based reimbursement for genuinely complex hospital outpatient work: surgery, emergency care, high-risk infusions. The problem is what came after. Hospitals bought up routine physician practices and moved ordinary office visits into OPPS billing. The service did not change. The billing category did, and Medicare started paying hospital rates for office work.
The Mechanism in Plain Numbers
A hospital acquires a cardiology practice. Same physicians, same building, same equipment. CMS approves the provider-based designation. Before the acquisition, a Medicare echocardiogram billed as a single office rate of about $188. After, the same study generates two payments: a hospital facility fee of about $548 plus the cardiologist's $65 reading fee, for about $614 total. Medicare pays roughly $426 more for the identical test in the identical room. The patient's copay rises too, because it is 20% of the higher OPPS amount, not the lower office rate.
The rate uplift is automatic. It is not the hospital negotiating harder; it is the billing system switching. Capps, Dranove, and Ody (2018, Journal of Health Economics) found that prices for hospital-acquired physicians rose 14.1% on average, with nearly half of that traceable to the site-of-service shift alone.
The same uplift travels into commercial insurance, because commercial HOPD rates are negotiated as multiples of the published Medicare rate, the same transmission documented in Issue #3: The 254% Problem. Higher Medicare benchmark, higher commercial rate, higher copays, higher employer premiums (the wage-tax mechanism from Issue #9: The Employer Trap). This is a distinct layer from the market-power premium in Issue #12: The Consolidation Tax: the facility fee uplift happens on day one of a provider-based designation, whether or not market power changes at all.
The Regulatory Timeline
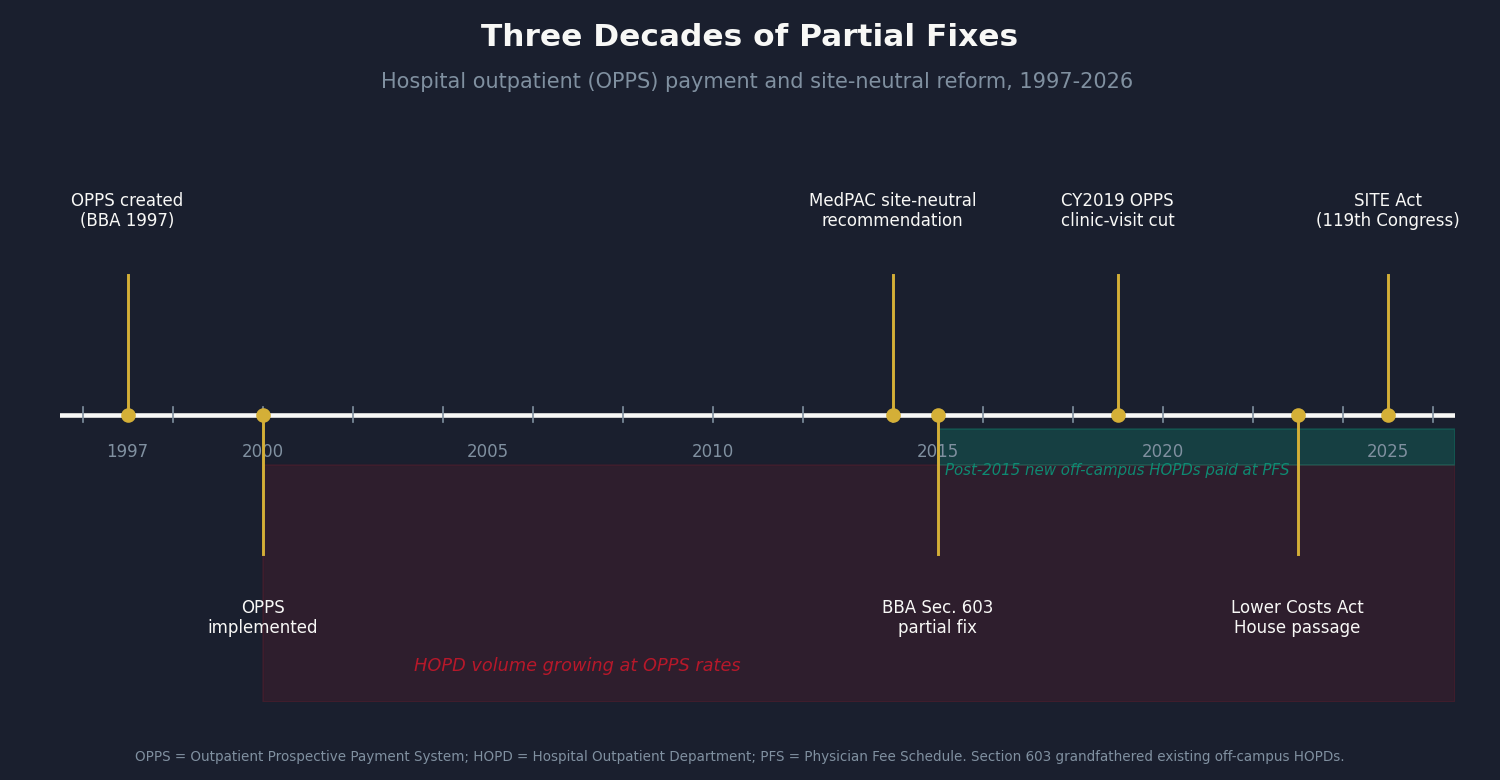
- 1997-2000: The Balanced Budget Act creates OPPS; CMS implements it for complex hospital outpatient services.
- 2000-2015: Hospitals accelerate practice acquisitions. Routine services migrate from PFS to OPPS billing; HOPD spending outgrows utilization.
- 2014: MedPAC publishes its first site-neutral analysis and recommends rate equalization for office-equivalent services. Congress does not act.
- 2015: Section 603 of the Bipartisan Budget Act applies PFS rates to new off-campus HOPDs created after November 2, 2015. The partial fix. It leaves untouched all on-campus HOPDs, all pre-2015 off-campus facilities, and every future on-campus acquisition.
- 2019: CMS extends site-neutral rates to clinic visits at grandfathered off-campus HOPDs. Hospital groups sue; litigation narrows the scope.
- 2023-2026: Multiple site-neutral bills are introduced. The Lower Costs, More Transparency Act passes the House (2023) and stalls in the Senate. The Site-Based Invoicing and Transparency Enhancement (SITE) Act follows in the 119th Congress. The CY2026 OPPS Proposed Rule adds further site-neutral provisions.
Twelve years separate MedPAC's 2014 recommendation from today's still-partial fix, twelve years of hospital-rate billing on services MedPAC's own clinical advisors flagged as office-equivalent.
The Math: $2.55 Billion per Year
The computation downloads three public federal files, joins them by billing code, and computes a per-procedure savings for the two clean categories. The files are CMS OPPS Addendum B (CY2025, the HOPD facility rate), the CMS PFS Relative Value file RVU25D (CY2025, the office rate), and the Medicare Physician and Other Practitioners by Geography and Service file (2023, the volume).
The two booked categories:
- Clinic visits (9 codes, 18.5 million HOPD visits/year): $1.821 billion. The office-visit codes billed when a patient is seen at a hospital-owned clinic.
- Minor procedures (6 codes, 0.5 million services/year): $0.146 billion. Joint and bursa injections and a few other minor ambulatory procedures in MedPAC's office-equivalent set.
That is a $1.967 billion clean Medicare base. (Rates are 2025; volume is 2023, so this is a 2025-rate counterfactual on 2023 use; the true current figure is likely somewhat higher as HOPD volume keeps growing.)
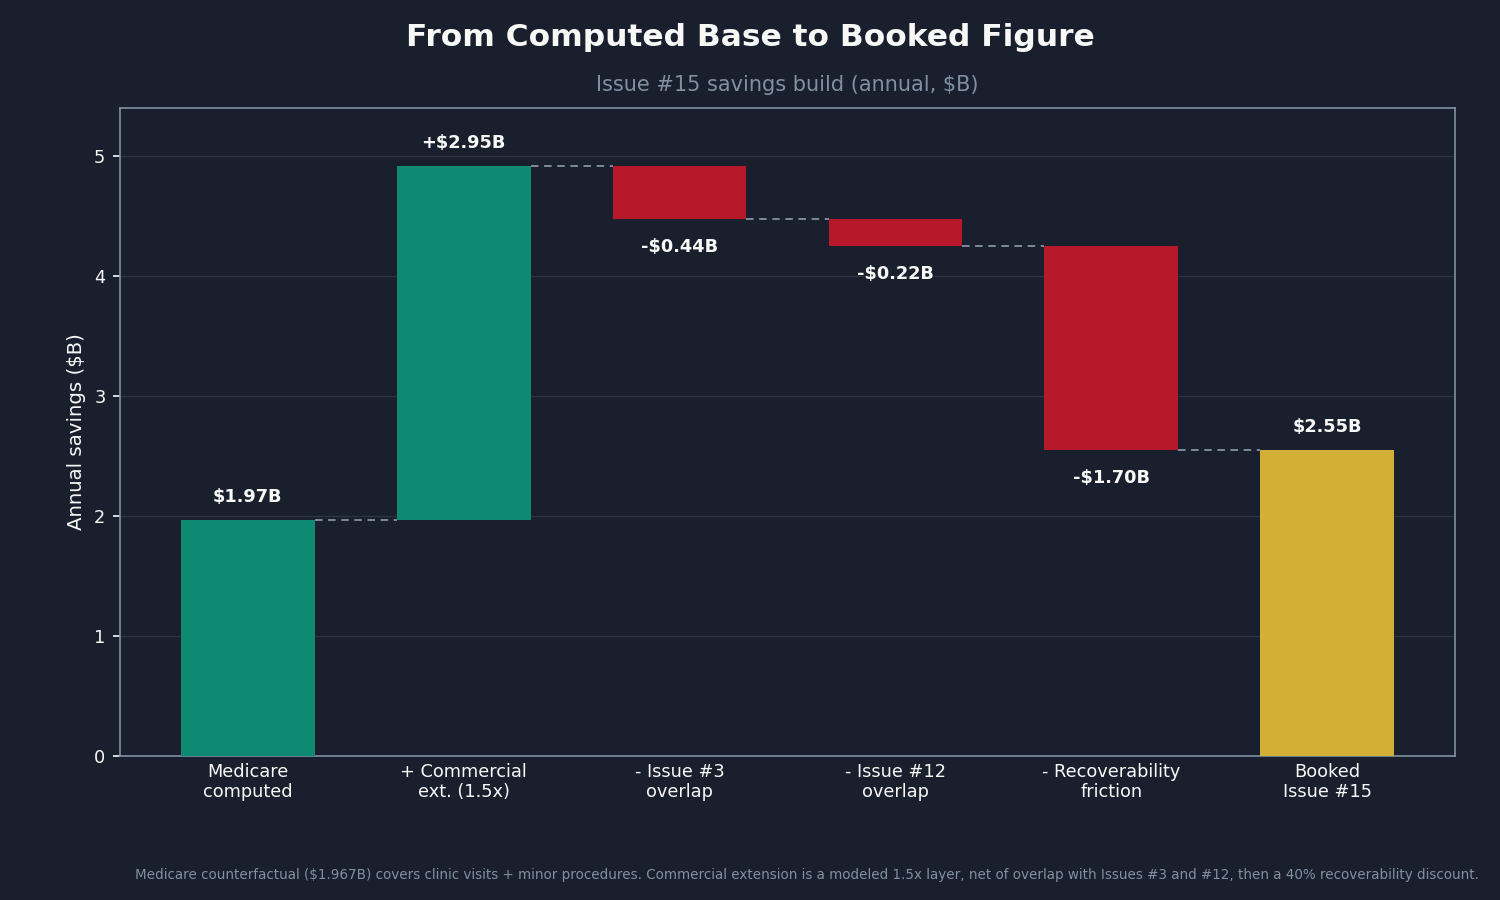
The build to the booked number:
- Medicare base (clinic visits + minor procedures): $1.967B
- Commercial extension, gross (conservative 1.5x Medicare): +$2.950B
- Less Issue #3 overlap (15% of commercial): -$0.443B
- Less Issue #12 overlap (5% of gross): -$0.224B
- Less recoverability friction (40%, for legislative grandfathering delays): -$1.700B
- Booked savings: $2.55B (range $0.93B to $4.13B)
The commercial extension uses a conservative 1.5x multiplier rather than the full 2.54x RAND ratio from Issue #3, which reflects an inpatient-weighted hospital-wide average. As a check: MedPAC's published ambulatory site-neutral aggregate is about $6.6 billion, but that includes imaging and drug administration, which this analysis cannot isolate from public data. The clinic-visit slice ($1.82B/yr) is consistent with the Congressional Budget Office (CBO) clinic-visit-only score (roughly $3-7B over ten years). The booked base sits well below MedPAC's total precisely because it excludes the two largest categories.
Two Categories We Cannot Compute (Yet)
Diagnostic imaging and drug administration are both larger than everything booked above, and both are on MedPAC's site-neutral list. Neither can be computed cleanly from public files.
For imaging, the public Medicare file flags whether a service was paid at the facility or office rate, but that flag lumps inpatient, emergency-department, ambulatory surgery center, and HOPD together. High-dollar imaging like chest X-rays and CT scans is heavily ordered in emergency rooms and for inpatients, settings where the study would never have been done in an independent office regardless of billing. Applying a site-neutral estimate to the full facility-setting count would badly overstate the opportunity. For drug administration (chemotherapy, biologic infusions, IV hydration), HOPD volume is bundled into Comprehensive payment groups, so the per-code count simply is not in the public file.
Both gaps need the same thing: claims-level data with an outpatient-specific setting flag, the kind in CMS's Limited Data Set, a state All-Payer Claims Database, or commercial repositories (MarketScan, Optum, IQVIA). The methodology is already built; the missing input is the HOPD-outpatient volume by code.
If you work with any of these datasets or hold an active Data Use Agreement, we want to hear from you. The booked $2.55 billion is conservative because it excludes these two categories. With the right inputs, the number grows substantially. Reach out at contact@ahcdata.fund or ahcdata.fund.
Three Objections
"Hospitals carry real overhead that offices don't, so the facility fee is justified." True for genuinely complex services, which is exactly why MedPAC's list is narrow. It excludes oncology infusion, emergency suites, and anything where hospital standby capacity is part of the care. It includes office visits, joint injections, and minor procedures a competent physician delivers safely in an independent office without a trauma bay upstairs. The question is not whether hospitals have higher overhead. It is whether a routine clinic visit justifies a two-to-four-to-one payment ratio. MedPAC's repeated cost analysis says no.
"Site-neutral payment will close rural hospitals." Real for a specific subset. Rural and critical-access hospitals sometimes use HOPD billing to cross-subsidize inpatient capacity in places with no alternative. The fix here explicitly preserves and extends grandfathering for those facilities (a forthcoming issue, Issue #35: The Rural Hospital Bond Trap, will treat rural finances directly). That legitimate concern should not shield the much larger universe of on-campus HOPDs at big urban systems, where the facility fee is margin capture, not an access lifeline.
"The 2015 Bipartisan Budget Act already fixed this." It fixed one slice: new off-campus HOPDs built after November 2, 2015. On-campus HOPDs still bill OPPS rates. Pre-2015 off-campus facilities still bill OPPS rates. The $1.967 billion computed here exists in CMS data that postdates the 2015 reform. The partial fix is real; it left most of the problem intact.
Who Profits
This is not a story about individual hospitals overcharging. It is a payment architecture that rewards provider-based billing, and the organizations that built business models around capturing the differential. These profiles document institutional mechanisms, not individual physicians or clinical staff.
HCA Healthcare (HCA) FY2024 Revenue: $70.6B | Operating Margin: ~13% | CEO Comp (Sam Hazen): ~$24M | Stock Buybacks (2020-24): ~$14B | Lobbying (2020-24): ~$28M This issue's mechanism: HCA operates 182 hospitals and affiliates with roughly 50,000 physicians. Its employed-physician strategy converts independent practices to provider-based status, shifting billing from PFS to OPPS. The mechanism here is distinct from HCA's appearances in Issue #3, Issue #12, and Issue #14: the site-of-service rate uplift begins the day a practice converts, before any commercial renegotiation or consolidation premium. HCA's FY2024 outpatient revenue was $33.4B, of which OPPS-billed clinic visits and procedures are a material component.
Sources: HCA Healthcare FY2024 Form 10-K and DEF 14A via SEC EDGAR; OpenSecrets.org federal lobbying database (2020-2024).
Tenet Healthcare / United Surgical Partners International (THC / USPI) FY2024 Revenue: $20.7B | USPI Segment Adjusted EBITDA Margin: ~40% | CEO Comp (Saum Sutaria): ~$15M | Stock Buybacks (2020-24): ~$2B | Lobbying (2020-24): ~$8M This issue's mechanism: USPI, Tenet's ambulatory division, runs a procedure-heavy portfolio billing under OPPS for services in MedPAC's site-neutral set, including orthopedic injections and minor procedures where the office-equivalent rate is far lower. The segment's ~40% adjusted EBITDA margin, against single digits at most hospital segments, is partly a function of billing the OPPS rate for work that pays substantially less under PFS.
Sources: Tenet Healthcare FY2024 Form 10-K and USPI segment disclosures via SEC EDGAR.
UnitedHealth Group / Optum Health (UNH) FY2024 Revenue: $400.3B | Operating Margin: ~8.4% | CEO Comp (Andrew Witty): $26.3M | Stock Buybacks (2020-24): ~$25B | Lobbying (2020-24): ~$65M This issue's mechanism: Optum Health employed roughly 90,000 physicians as of 2024 and has acquired ambulatory surgery centers at pace. A February 2026 Health Affairs study found Optum's ASC acquisitions were associated with an 11% price increase to competing commercial insurers. When UnitedHealth acquires a practice or surgery center, the billing setting shifts to HOPD or ASC, the higher Medicare rate applies, and UnitedHealth profits as the care-delivery operator while also setting the commercial benchmark as the dominant insurer in many markets. UNH also appears in Issue #8, Issue #11, and Issue #12.
Sources: UnitedHealth Group FY2024 Form 10-K and DEF 14A via SEC EDGAR; Health Affairs 45(2):218-225 (Feb 2026, DOI 10.1377/hlthaff.2025.01062); OpenSecrets.org federal lobbying database (2020-2024).
The Fix
Three levers, from what CMS can do today to what Congress must authorize. All three should carry a rural and critical-access carve-out.
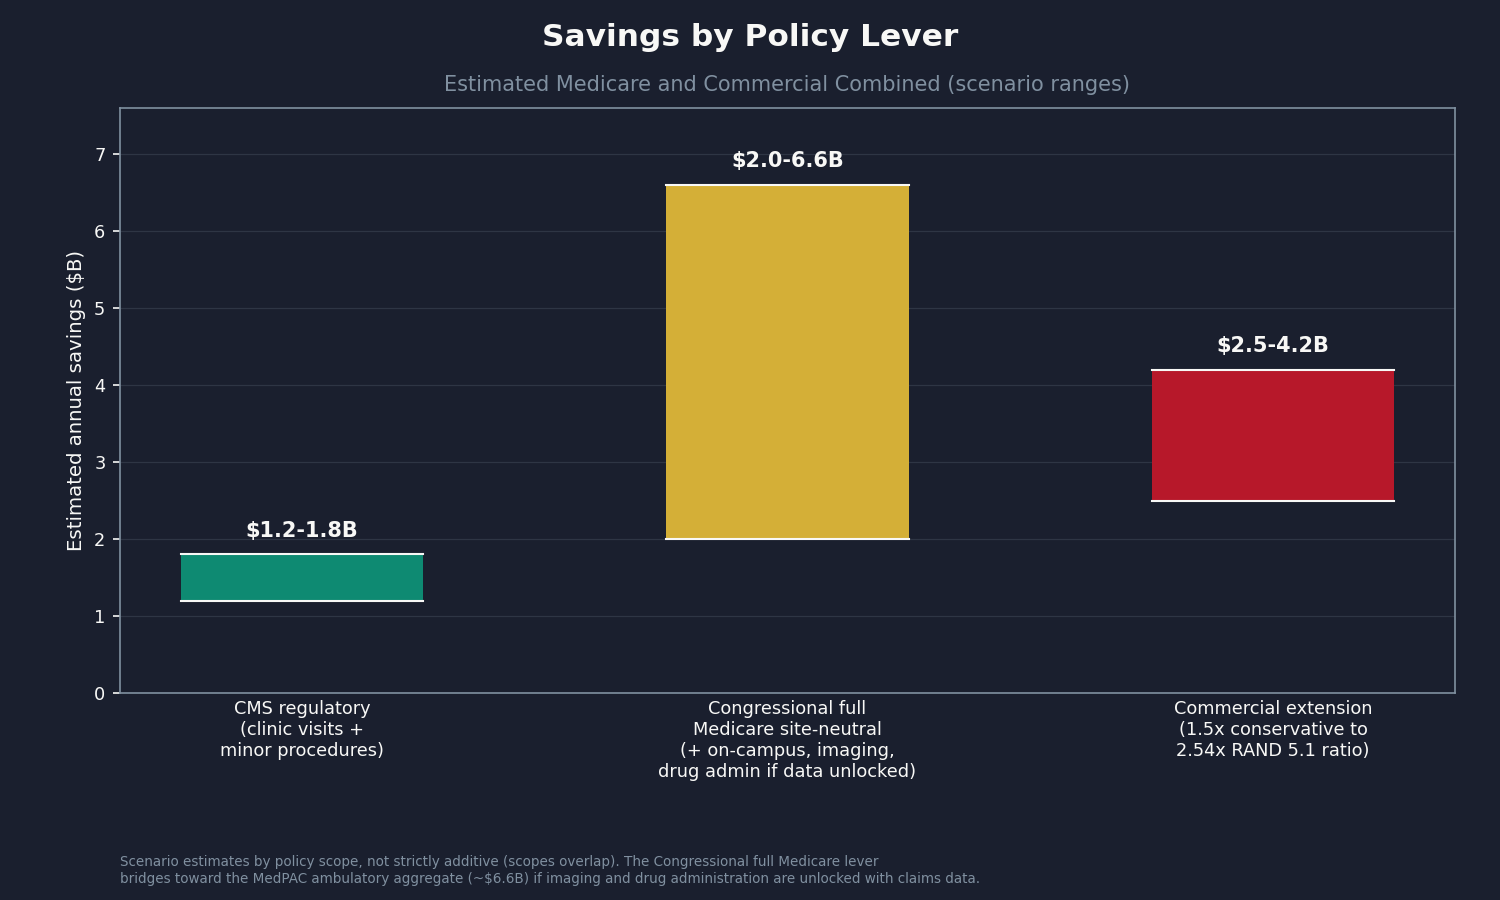
Lever 1 (CMS regulatory): Extend site-neutral payment to more MedPAC candidate categories. CMS already has the authority through annual OPPS rulemaking, and the CY2019 rule and CY2026 Proposed Rule both show the path. It needs the willingness to finalize a rule over hospital-industry opposition, not new statutory authority. Estimated Medicare savings: roughly $1.2 to $1.8 billion per year.
Lever 2 (Congress): Pass full site-neutral legislation. The SITE Act and the Lower Costs, More Transparency Act would extend site-neutral rates to grandfathered and on-campus HOPDs, the bulk of the volume the 2015 and 2019 reforms left untouched. CBO has scored comprehensive clinic-visit reform at $3 to $7 billion over ten years; adding imaging and drug administration, once computable from claims data, would raise that substantially. The provisions have bipartisan support but keep stalling against hospital lobbying and rural concerns, which the carve-out is designed to address.
Lever 3 (commercial transparency): State facility-fee laws plus federal disclosure mandates. Seven states (Connecticut, Indiana, Minnesota, Ohio, Maine, Colorado, Texas) have enacted facility-fee transparency laws since 2015. Federal transparency on the commercial site-of-service differential would let employers and self-insured plans negotiate against HOPD premiums directly. This is also the data-partner path: matched commercial claims would turn the modeled $2.5 billion commercial extension into a computed figure.
The rural carve-out: Every version should preserve grandfathering for genuinely rural and critical-access HOPDs. The target is the on-campus HOPD at a major urban system billing hospital rates for routine office visits, not the critical-access hospital cross-subsidizing the only emergency department within 50 miles.
Who can act: CMS holds Levers 1 and 3's regulatory portions through OPPS rulemaking, no legislation required. Congress holds Lever 2 and the federal parts of Lever 3. State legislatures hold state transparency law (seven have acted). Employers can act now, within current contracts, by adopting benefit designs that distinguish HOPD and office cost-sharing.
What's Next
Issue #16: The Other 100 Drugs (Part D). Issue #2 covered nine flagship Medicare Part D brand drugs at 7 to 581 times international peer prices. The next 100 by gross spend, excluding those nine, carry a similar gap. Issue #16 will compute each molecule's US Medicare price against the NHS Drug Tariff and the RAND international reference price, and book the recoverable share using Issue #2's rebate-net methodology.
If this issue raised a question your own data could answer, especially on the HOPD-outpatient share of imaging volume, drug-administration HOPD service counts, or the commercial site-of-service differential, reach out at contact@ahcdata.fund.
Worked inside the system? We talk with people who have seen hospital billing, pharmacy benefit manager pricing, insurer prior authorization, or Medicare Advantage coding from the inside. If you can help us understand how these processes actually work, or point us to documentation that does, we would value a conversation, on background and in confidence. Reach us at contact@ahcdata.fund.
All analysis code is at github.com/rexrodeo/american-healthcare-conundrum. If the math looks wrong, say so. That is the only way to get it right.
If this issue was useful, forward it to someone who pays for healthcare, which is everyone.
Sources: CMS OPPS Addendum B CY2025 and PFS RVU25D CY2025 (cms.gov); Medicare Physician and Other Practitioners by Geography and Service DY2023 (data.cms.gov); MedPAC March 2014, March 2023, and March 2025 Reports (medpac.gov); Bipartisan Budget Act of 2015 Section 603; 42 C.F.R. 413.65; Capps/Dranove/Ody 2018 (J Health Econ 59:139-152, DOI 10.1016/j.jhealeco.2018.04.001); Health Affairs 45(2):218-225 (2026, DOI 10.1377/hlthaff.2025.01062); Lower Costs More Transparency Act (H.R. 5378, 118th Cong.); SITE Act 119th Cong.; CMS CY2019 OPPS Final Rule and CY2026 OPPS Proposed Rule; state facility-fee laws (CT, IN, MN, OH, ME, CO, TX); HCA, Tenet, and UnitedHealth Group FY2024 10-K and DEF 14A via SEC EDGAR; OpenSecrets.org federal lobbying database (2020-2024).
Running total after Issue #15: $519.35B / $3.24T (16.0%)
Methodology footnotes: Medicare savings of $1.967B computed per HCPCS from CMS OPPS Addendum B CY2025 facility rates, CMS PFS RVU25D CY2025 non-facility allowed amounts, and Medicare Physician and Other Practitioners by Geography and Service DY2023 Place of Service = F volume. Booked: clinic visits (9 codes, 18.5M visits, $1.821B) and minor procedures (6 codes, 0.5M services, $0.146B). Imaging (358 codes, gross $4.68B) and drug administration (96360-96549) are excluded: the Physician PUF facility flag cannot isolate HOPD-outpatient volume from inpatient, ER, ASC, and SNF settings, and for imaging the inpatient/ER share dominates high-dollar codes; drug-administration HOPD volume is packaged into Comprehensive APCs and unavailable per-HCPCS in public files. Both require claims-level data (CMS LDS/VRDC, state APCD, MarketScan). Rate year (2025) and volume year (2023) differ by two years. Commercial extension: 1.5x Medicare (full RAND 5.1 ratio 2.54x forms the range ceiling). Overlap: 15% of commercial for Issue #3; 5% of gross for Issue #12; 0% for Issue #14. Recoverability: 60% central (range 50-70%). Cross-validation: MedPAC ambulatory aggregate (~$6.6B) includes imaging and drug administration; the booked base ($1.967B) is a clean conservative subset; CBO clinic-visit scoring (~$3-7B over ten years) is consistent. Denominator: $3.24T US-Japan per-capita gap (CMS NHE 2024 final, OECD Health at a Glance 2025). All code: github.com/rexrodeo/american-healthcare-conundrum.
Cumulative after Issue #14: $516.8B. Issue #15 adds $2.55B. New cumulative: $519.35B.
The American Healthcare Conundrum publishes when the data is ready. All analysis uses publicly available data. Code is open-source. Figures are validated before publication.
Get every issue in your inbox
The American Healthcare Conundrum is free. One fixable problem in U.S. healthcare, with the data, every week.