Issue #8: The Denial Machine
How insurers use prior authorization denials to extract $24 billion per year from Medicare Advantage patients
Each issue of The American Healthcare Conundrum identifies one fixable problem in U.S. healthcare spending, builds the data case, and recommends a specific policy fix. All analysis uses publicly available data. Code is open-source.
Target: ~$3T US-Japan per-capita gap
Japan: highest life expectancy, lowest
infant mortality in OECD, ~half US cost

Full scale: $0 ──────────────── $3T
            ███████░░░░░░░░░░░  14.0%
            ↑ $420.6B identified

Zoomed (first $500B):
 #1  ░        $0.6B   OTC Drug Overspending
 #2  ███      +$25.0B  Drug Pricing
 #3  ██████████  +$73.0B  Hospitals
 #4  ████      +$30.0B  PBM Reform
 #5  ████████████████████████████  +$200.0B  Admin Waste
 #6  ████      +$28.0B  Supply Waste
 #7  █████     +$40.0B  GLP-1 Pricing
 #8  ███      +$24.0B  Denial Machine
     ─────────────────────────────────────────────
     Total: $420.6B · $2,579.4B remaining
The Denial Machine
Medicare Advantage insurers approve 95.4 percent of prior authorization requests. That's what UnitedHealthcare, Humana, CVS, Elevance, and Cigna report to Medicare.
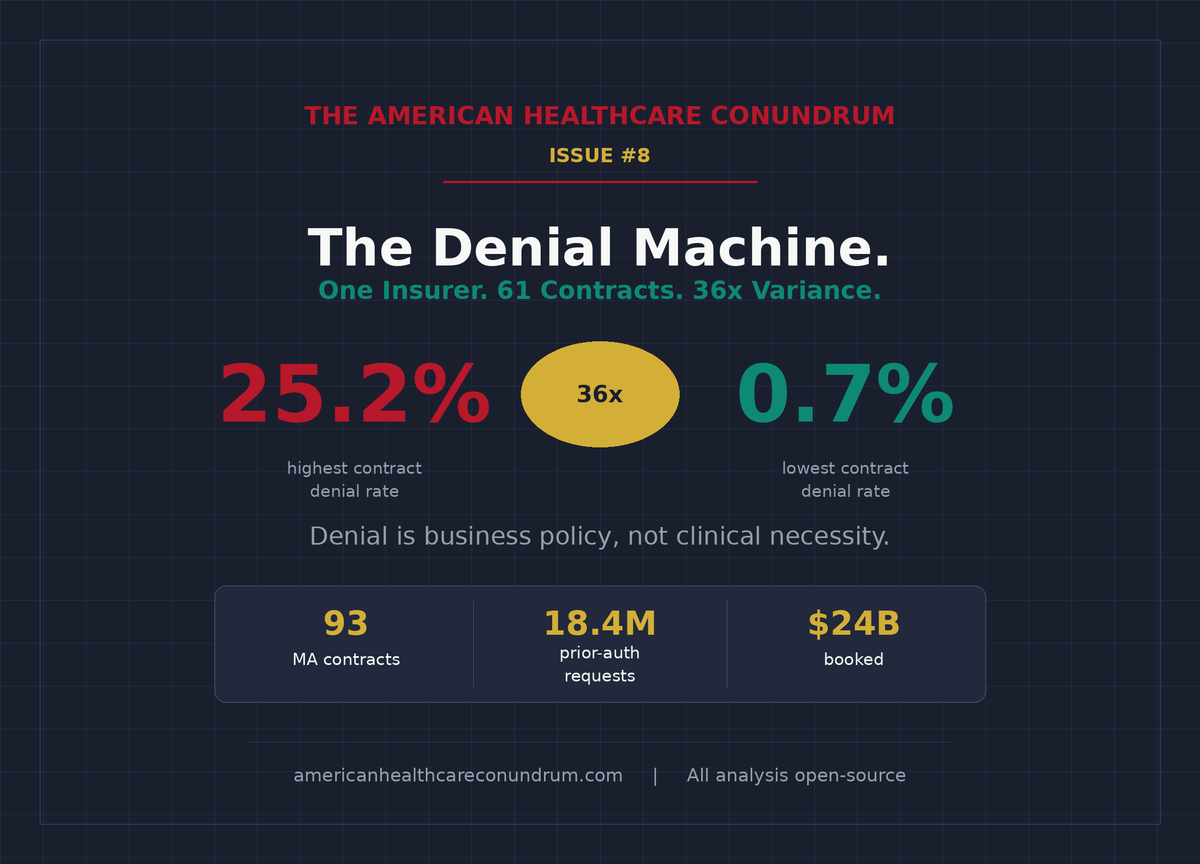
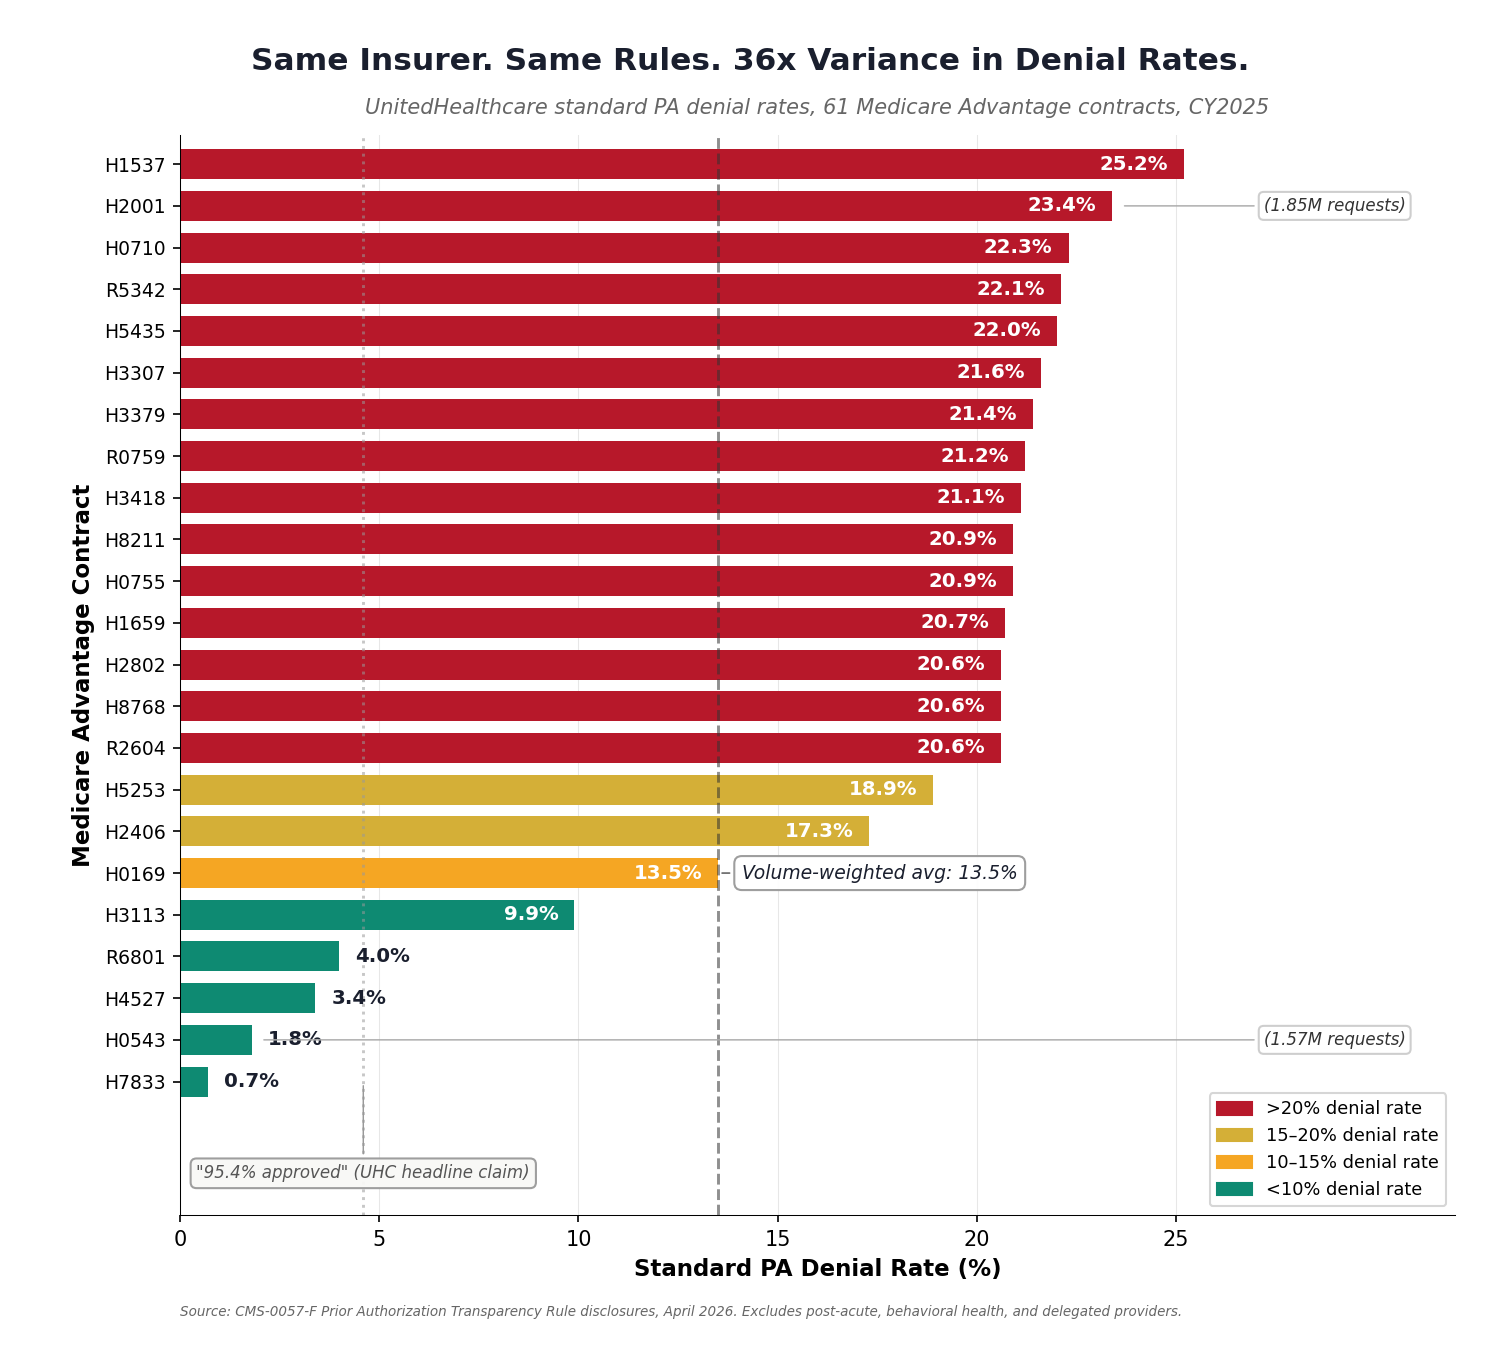
But their own contract-level data, disclosed for the first time under the CMS-0057-F Prior Authorization Transparency Rule (April 2026), tells a different story. Across 61 UnitedHealthcare contracts covering 7.9 million patients, the actual denial rate ranged from 0.7 percent to 25.2 percent. Same company. Same rules. Same eligibility criteria. Thirty-six times variance.
The 95.4 percent headline is misleading because it weights all requests equally, including routine renewals and pre-approved services that inflate the denominator. When you strip those out and look at the volume-weighted denial rate for standard (non-expedited) requests, UnitedHealthcare denies 13.5 percent of claims across its Medicare Advantage book. That's not 95.4 percent approval. That's roughly one in seven requests rejected.
This per-contract variance is the smoking gun. When the same insurer applies the same coverage rules to similar patients in overlapping geographies and produces denial rates that vary by 36 times, clinical judgment is not the variable. Business policy is.
For the patients caught in it, the denial machine means care suppression, disease progression, and $24 billion per year in extracted value from the healthcare system, with mechanisms we can see but cannot yet quantify that likely add tens of billions more.
What Actually Happens When Your Claim Is Denied
A patient with rheumatoid arthritis needs a biologic drug. The biologic is expensive, but it stops joint destruction. Before dispensing it, the insurer requires prior authorization: paperwork proving the cheaper drugs failed first.
The physician submits the PA. The insurer denies it. The patient receives a letter: "This service is not medically necessary at this time."
The physician can appeal. Most patients never find out. Even if the physician appeals, the delay is 20 to 45 days. The patient, in pain, postpones the medication. Some never follow up. Some switch to the insurer's own rheumatology clinic, where the biologic gets approved faster because that clinic is owned by the insurer, and approval there generates margin rather than cost.
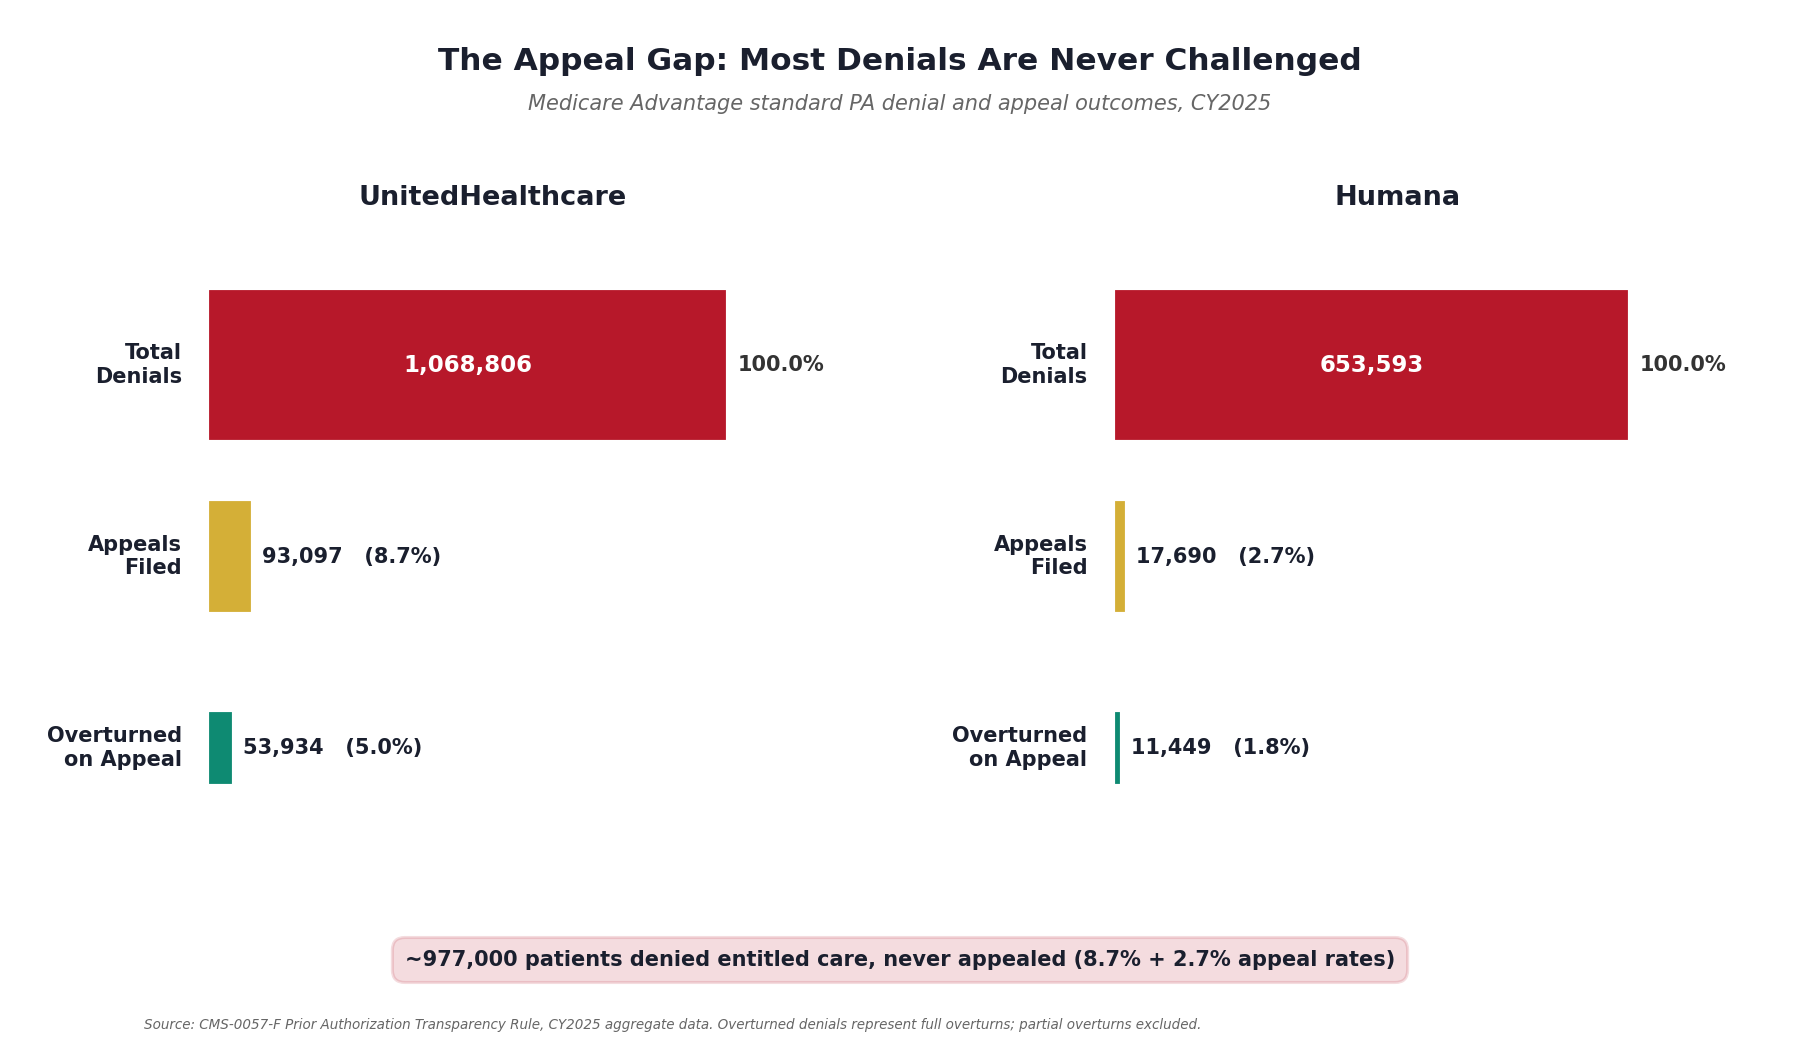
Those who do appeal have strong odds: CMS-0057-F disclosures show a 57.9 percent overturn rate at UnitedHealthcare and 64.7 percent at Humana. The insurer knew this when it denied the claim. The denial was a bet: the probability that the patient wouldn't appeal (about 91 to 97 percent, depending on the insurer) times the savings from not paying for care, minus the cost of processing the rare appeal.
The Price Behind the Paperwork
Consider a case I watched unfold personally just last week. A woman very close to me needed a brain MRI. Her physician ordered the scan to investigate recurring migraines. She scheduled it at Touchstone, an in-network imaging center, in Denver, under her Anthem BlueCross PPO. The day before the appointment, Touchstone cancelled: Anthem had not returned the prior authorization.
Touchstone offered an alternative. Self-pay: $450. Same machine, same technicians, same radiologist reading the images. No authorization needed. Treatment for anything the MRI found would still go through insurance.
Here is where it gets interesting. Anthem's contract rate for the same scan is $3,000. That is 6.7 times the cash price. The insurer "negotiated" a rate that is 567 percent of what the imaging center charges a person who walks in and pays.
But the $450 cash price does not count toward her $3,400 annual deductible. Her family has already applied roughly $2,150 this year. If she pays $3,000 through insurance, only $850 comes out of pocket (the remaining balance to hit the deductible), and every claim after that is covered at 100 percent for the rest of the year. If she pays $450 cash, it saves money today but the deductible clock stays where it is. The next claim starts from the same $2,150 mark.
The insurer has built a trap with three walls. The prior authorization requirement creates friction that delays or prevents care. The inflated contract rate (6.7 times the cash price) means every dollar that does flow through insurance maximizes premium justification. And the deductible structure makes the patient financially rational to pay $850 instead of $450, because only the inflated price counts toward the threshold that unlocks full coverage.
This is not an edge case. Every American with a high-deductible health plan faces this calculation every time a prior authorization is delayed. The insurer profits whether the patient goes through insurance (inflated rate) or self-pays (deductible clock stalls). The only person who loses is the patient.
Our original analysis, crossing CMS March 2026 Medicare Advantage enrollment data (35.6 million beneficiaries across 7,606 plans) with KFF CY2024 prior authorization reporting, quantifies the scale. UnitedHealthcare generates 8.4 million PA requests per year from its 9.4 million MA enrollees. Of those, 1.06 million are denied. Only 127,000 are appealed. That leaves 934,000 denials never challenged, of which an estimated 736,000 were wrongful (applying the insurer's own overturn rate to the non-appellant population).
A silent denial is a denial the patient never appeals. The care doesn't happen, the insurer's decision stands, and no regulator ever sees the outcome.
Across all seven major MA insurers, the numbers are: 57 million PA requests, 4.1 million denials, 496,000 appeals, and 3.6 million silent denials. Of those silent denials, an estimated 2.8 million were wrongful: patients denied care they were entitled to who never appealed.
The ACA Marketplace: 70 Percent of Denials Are Administrative
The denial machine isn't limited to Medicare Advantage. Our original analysis of the KFF ACA Marketplace 2024 Working File (2,540 plans across all 50 states) reveals that ACA marketplace insurers denied 75.9 million of 374 million claims in 2024, a 20.3 percent overall denial rate.
The reason breakdown tells the real story. Of all coded denials, 69.7 percent were administrative or procedural: referral requirements (9.6 percent), administrative errors (25.9 percent), member coverage issues (7.6 percent), or the catch-all "other" category (37.1 percent). Only 20.5 percent of denials were clinical, meaning medical necessity, benefit limits, excluded services, or investigational/cosmetic. The remaining 9.8 percent were network-design denials (out-of-network providers).
The issuer-level variation is extreme. The KFF data shows ACA denial rates ranging from 3.5 percent to 47.0 percent across issuers, with a median of 20.9 percent. Moda Health in Alaska denied 47.0 percent of claims. CareSource in North Carolina denied 37.0 percent. UnitedHealthcare subsidiaries in Louisiana, Michigan, and Ohio denied 33 to 36 percent of claims. These are not clinical decisions. These are business models.
The Denial Trend: 2 Percentage Points in Five Years
Prior authorization volume in Medicare Advantage has grown from 37.1 million requests in 2019 to 52.8 million in 2024, per KFF historical reporting. The denial rate has climbed from 5.7 percent (2019) to 7.7 percent (2024).
Our original trend analysis computes excess denials: the number of denials above what would have occurred if the 2019 baseline rate (5.7 percent) had held steady as volume grew. In 2024 alone, that excess was 1.06 million denials. Cumulatively from 2020 to 2024: 2.2 million excess denials attributable to the rate increase, not volume growth.
This is the denial machine accelerating: more requests processed, at a higher denial rate, generating more revenue from each percentage point of increase.
The Savings Opportunity: What We Can Measure, and What We Can't Yet
The denial machine extracts value through several mechanisms, but only some can be quantified cleanly from public data. Two big ones can: Component A captures downstream healthcare costs from foregone care, and Component B captures margin extracted through ownership structures. They target different pools of money and are additive. Component E is a small documented overpayment from risk adjustment coding. Two more mechanisms are real and visible but not yet measurable from public data. The rise in denials tied to automated (AI) review is documented in direction but has never been measured as a national dollar figure. And the deductible-delay trap shown in the MRI vignette above is measurable in principle but requires claims-level data to quantify cleanly. We describe both below and ask for help closing the estimates.
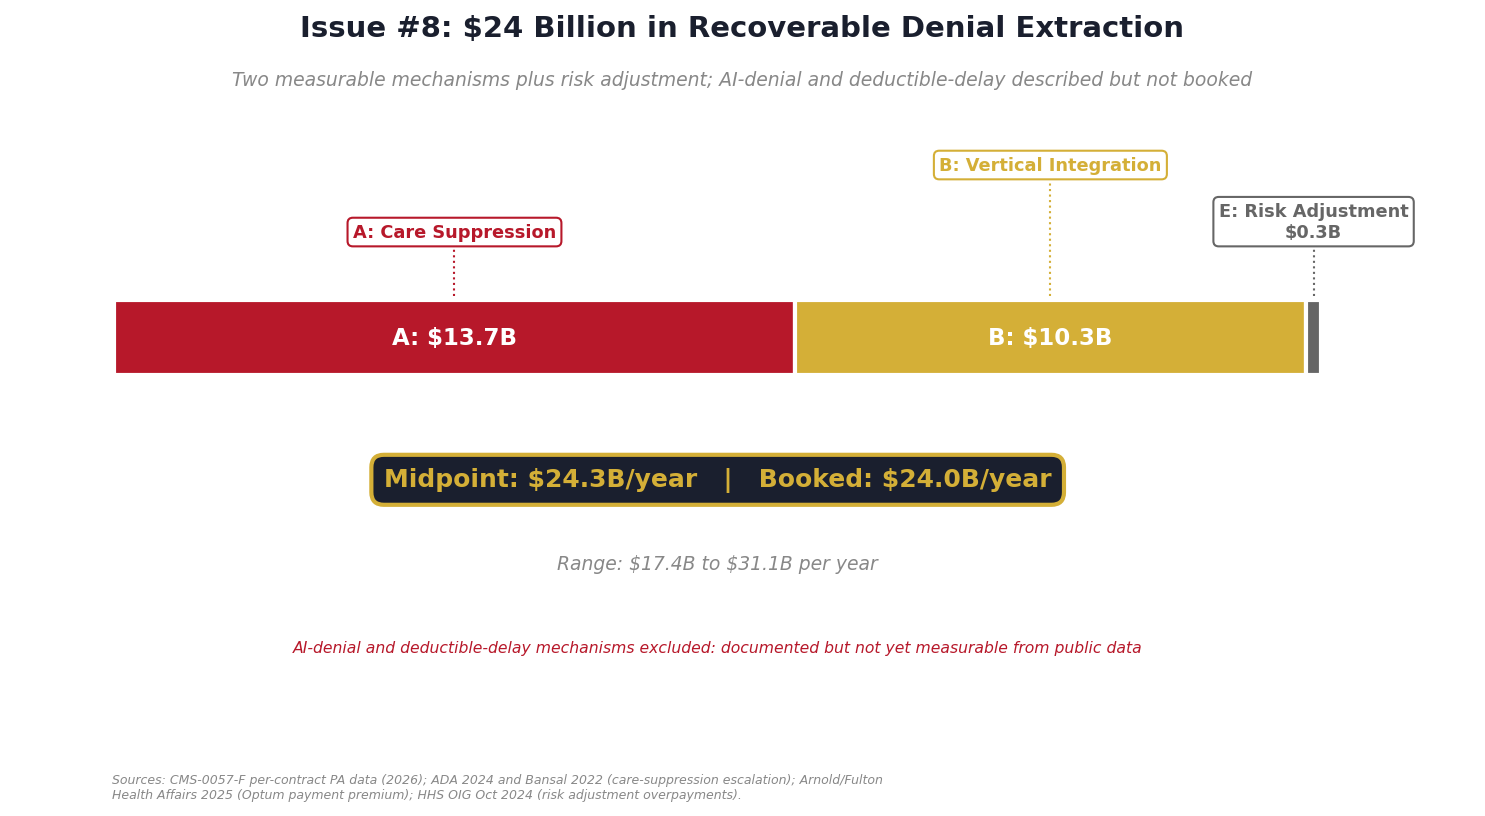
Component A: Care Suppression ($10.4B to $17.0B per year)
When 2.8 million MA patients are denied entitled care and never appeal, the denied care is foregone permanently. The disease progresses, and treating a progressed disease costs more than treating it on time. The American Diabetes Association's 2024 Cost of Diabetes study (Parker et al., Diabetes Care) finds that people with diagnosed diabetes run medical costs about 2.6 times a comparable person without it, and Bansal et al. (Diabetes Therapy 2022) find that a patient whose blood sugar is uncontrolled costs roughly 20 percent more per year than one whose diabetes is managed. When a required drug is denied outright, the effect compounds: Fung et al. (JMCP 2023) found that type-2 diabetes patients denied a prior-authorization drug ran up higher downstream medical costs paid by the plan. For cancer, the direction is the same, though the size varies by cancer type: catching a tumor a stage later raises first-year treatment costs.
We model this as a blended 12 to 18 percent downstream cost escalation on the pool of denied, foregone care, weighted toward chronic conditions where the compounding is steepest. With 3 million annual denials in Medicare Advantage, that puts the suppression cost at $8.8 to $13.3 billion per year. Adding the AMA 2024 Physician Survey's finding that 8 percent of patients with PA delays experienced death, permanent damage, or disability (a 1 to 4 percent multiplier on denied care costs), the total care suppression component reaches $10.4 billion to $17.0 billion per year (mid: $13.7B).
Component B: Vertical Integration Margin Arbitrage ($6.7B to $13.8B per year)
The largest insurers own the providers delivering care. UnitedHealthcare owns Optum Health ($105.4 billion in FY2024 revenue, per UnitedHealth 10-K). CVS owns MinuteClinic (1,100+ locations) and primary care clinics through Aetna. Elevance owns Carelon's practice networks. Cigna owns Evernorth.
This creates a mechanism where the insurer can pay its own providers more than it pays competitors and capture the margin internally. Here's how it works in practice: when UnitedHealthcare buys care from Optum, every dollar of inflated price stays within UnitedHealth Group. When it buys from an independent hospital, the excess goes to the hospital. Vertical integration makes overpaying your own network profitable.
A November 2025 Health Affairs study found that UnitedHealthcare pays Optum-owned providers 17 percent more than external providers for identical services. In concentrated markets (greater than 25 percent UHC market share), the premium reaches 61 percent.
The Big 4 insurers control 25.3 million MA enrollees (CMS March 2026 enrollment data). They collectively manage roughly $462 billion in MA spending (CMS NHE 2023, MA share). An estimated 8 to 15 percent flows to owned provider networks: roughly $39 billion. At a 17 to 35 percent payment premium (Health Affairs 2025), that translates to $6.7 billion to $13.8 billion per year (mid: $10.3B) in extracted margin recoverable through rate normalization.
Automated Denials: A Documented Trend We Cannot Yet Price
As insurers move prior-authorization review onto automated and algorithmic systems, the volume of denials has climbed, and the timing lines up closely enough that the two look connected. The Senate Permanent Subcommittee on Investigations reported in October 2024 that UnitedHealth's denial rate for post-acute care rose from 10.0 percent in 2020 to 22.7 percent in 2022 as it rolled out automation; Humana's long-term acute-care denials rose 54 percent over a similar window, and CVS prior-authorization volume rose 58 percent. The nH Predict algorithm at the center of Lokken v. UnitedHealth was alleged to carry a 90 percent error rate on appeal, and the case survived a motion to dismiss in February 2025. Cigna's PxDx system, reported by ProPublica in 2023, let reviewers reject batches of claims in seconds. In the American Medical Association's 2024 survey, 61 percent of physicians said they were concerned that insurers' unregulated use of AI was increasing denials.
The direction is documented. The magnitude is not. A 2026 commentary in npj Digital Medicine ("Medicare advantage becoming a disadvantage with use of artificial intelligence in prior authorization review") makes the point directly: no study has measured denial rates with and without automated review across matched plans, so there is no national estimate of how many additional denials automation causes, or what they cost. We are not going to invent one. We name the mechanism, show the direction, and treat the dollar figure as an open question. Answering it cleanly needs the same kind of matched, plan-level data described in the deductible-delay ask below, and it is part of what we are asking data partners to help us measure. The 2024 Medicare Advantage final rule (CMS-4201-F) already constrains algorithmic prior authorization; whether that is enough depends on a number no one has yet computed.
Deductible-Delay Extraction (we can see it, we cannot yet measure it)
The MRI vignette above is not merely anecdote. It is a measurable category of insurer extraction. But measuring it honestly requires data we do not yet have access to, and we would rather publish a gap we can explain than a number we cannot defend.
📍 The gap we can't yet measure, and how you can help close it
There is another mechanism in the denial machine that we believe runs into billions of dollars per year, but public data cannot cleanly quantify it yet. We are publishing what we know, and asking for help to measure what we can't.
The mechanism. When an insurer denies prior authorization on a shoppable service (MRI, CT, lab panel, planned procedure), many patients shift to cash pay. The cash price is typically a fraction of the negotiated rate, but cash does not count toward the in-network deductible. The patient saves money on that visit but restarts the deductible clock. The insurer avoids paying the claim AND keeps the inflated negotiated rate as the anchor for future encounters. Two ways to win from a single denial.
A concrete case (the vignette at the top of this issue). Brain MRI. Anthem denies PA. Touchstone cash price $450. Anthem's negotiated rate $3,000. Patient either pays $450 cash (saves $2,550 today, deductible clock stalls) or waits weeks for PA resolution and pays $850 out of pocket to hit a $3,400 deductible (more expensive short-term, but unlocks 100 percent coverage after).
Two ways to win from a single denial.
Path A, patient shifts to cash. $450 at the facility. Nothing applied to the deductible. The next claim still starts at $2,150 of a $3,400 deductible. The insurer avoids paying the claim and keeps the $3,000 negotiated rate anchored for every future encounter at that facility.
Path B, patient goes through insurance. Insurer-billed rate $3,000, which is 6.7× the cash price. The patient pays $850 toward the deductible. The plan pays the rest, and the spread between what the MRI actually costs and what the contract says it costs stays baked into the rate.
Why we cannot quantify this from public data alone. Testing the denial-induced deductible-delay claim requires matched patient-level data: claim denials, subsequent cash payments at the same facility for the same service code, and deductible exposure at the time of the encounter. CMS National Health Expenditure tables show the $505 billion out-of-pocket pool. Peterson-KFF shows deductibles are 52 percent of that. HCCI shows 30 to 43 percent of care is shoppable. Wang, Meiselbach, Cox, Anderson, and Bai (Health Affairs 2023) show the cash-vs-negotiated wedge runs 50 to 67 percent on 70 shoppable services. These give us the scale. None of them give us the denial linkage.
What would break this open. Matched patient-level claims and deductible-exposure data. If your organization holds licensed access to Truven/MarketScan, Optum Clinformatics, IQVIA Pharmetrics, or Definitive Healthcare, or if you have an active DUA for CMS LDS or VRDC, a state All-Payer Claims Database, or AHRQ HCUP: please reach out at ahcdata.fund or email contact@ahcdata.fund. Co-publication under your DUA is fine. Code stays open. Findings stay published. We will turn the MRI case into a verifiable per-procedure number and credit you by name.
Component E: Risk Adjustment Coding ($0.3B per year)
The HHS Office of Inspector General found in October 2024 that Medicare Advantage plans inflate risk scores by documenting diagnoses not supported by medical records. The documented overpayment: $0.3 billion annually industry-wide.
Consolidated Estimate
Component midpoints: $13.7B (A) + $10.3B (B) + $0.3B (E) = $24.3B. Conservative floor: $17.4B. Upper range: $31.1B. We book $24.0B, near the midpoint. Two further mechanisms are described above but excluded from this total: the rise in automated denials, whose direction is documented but whose national dollar value has never been measured, and the deductible-delay extraction shown in the MRI vignette, which requires claims-level data to quantify. We believe both add materially to the figure, but we book only what public data can prove.
MLR Gaming: The Accounting Trick That Enables Everything
The Affordable Care Act requires insurers to spend at least 80 percent of premium revenue on actual medical care (the Medical Loss Ratio rule). Our original analysis of CMS Medical Loss Ratio Public Use Files (2019-2024) reveals how the largest insurers game this threshold.
The industry-wide MLR in 2024 was 88.9 percent on $1.586 trillion in total premiums (CMS MLR PUF 2024). But the Big 5 insurers (UnitedHealth, Elevance/Anthem, CVS/Aetna, Cigna, Humana) operate at an average MLR of just 80.6 percent on $190.8 billion in combined premiums, barely above the regulatory floor. That 8.3 percentage point gap between the Big 5 and the market average represents $15.8 billion in premiums that could flow to medical care but instead covers administrative costs and profit.
How do they stay so close to the floor? The mechanisms are documented by federal regulators and independent analysts: reclassifying administrative spending as "quality improvement" (which counts toward the 80 percent), exploiting three-year MLR averaging to smooth over bad years, routing inflated payments through captive reinsurance arrangements, and accruing "performance bonuses" as medical expenses that are never paid out. The Government Accountability Office flagged questionable quality-improvement expense classification as far back as 2018, and the Center for American Progress, Georgetown's Center on Health Insurance Reforms, and FREOPP have each catalogued how vertically integrated insurers push spending across the medical/administrative line. For scale, KFF reports that insurers rebated roughly $1.1 billion to consumers in 2024 for missing the floor, about $11.8 billion cumulatively since 2012; those rebates are what the rule claws back, not a measure of what the gaming leaves on the table.
Our CMS MLR PUF analysis also shows that total industry administrative expenses reached $183.6 billion in 2024 (11.6 percent of premiums), with the largest single category being "Other General and Administrative" at 52.2 percent of admin costs ($95.9 billion). This catch-all category has limited transparency requirements, creating room for expense reclassification.
We do NOT include MLR gaming in the booked $24B savings estimate because it targets a different mechanism (accounting treatment of premiums vs. denial-driven extraction). But tightening the MLR definitions would close the escape valve that makes the denial machine possible: if insurers couldn't game the 80 percent floor, the financial incentive to deny claims would diminish.
Who Profits
The five publicly traded insurers profiled below collectively hold more than 150 million covered lives and generated over $1.3 trillion in FY2024 revenue. The denial and vertical-integration mechanisms documented above are their dominant profit levers.
Who Profits: UnitedHealth Group (UNH) FY2024 Revenue: $400.3B | Operating Margin: 8.2% | CEO Comp (Andrew Witty, through Oct 2025): $26.3M | Stock Buybacks (2020-24): ~$33B | Lobbying (2020-24): ~$43M This issue's mechanism: Volume-weighted prior-authorization denial rate of 13.5 percent across 61 Medicare Advantage contracts (CMS-0057-F), contradicting the headline 95.4 percent approval figure. Optum vertical integration generates an estimated $2.1 to $3.2 billion in annual margin arbitrage (Health Affairs 2025 premium applied to Optum revenue). Operates at an 85.5 percent medical loss ratio, the lowest among major insurers (CMS MLR PUF 2024). In April 2026 the DOJ expanded its investigation from Medicare Advantage overpayments to anti-competitive conduct in Optum Rx and physician reimbursement. Stephen Hemsley named interim CEO after Andrew Witty's October 2025 departure.
Who Profits: CVS Health (CVS), Aetna FY2024 Revenue: $372.8B | Operating Margin: 3.1% | CEO Comp (David Joyner): $17.8M | Stock Buybacks (2020-24): ~$8.5B | Lobbying (2020-24): ~$46M This issue's mechanism: Aetna ran a 12 percent prior-authorization denial rate across its Medicare Advantage plans in CY2024 (KFF). MinuteClinic's 1,100+ locations give the combined entity an owned care channel to steer denied patients toward lower-cost internal providers. AI PA escalation reached 22 percent adoption in 2025 (KFF), matching industry leaders. Aetna MLR: 82.1 percent (CMS MLR PUF 2024).
Who Profits: Elevance Health (ELV) FY2024 Revenue: $175.2B | Operating Margin: 4.8% | CEO Comp (Gail Boudreaux): $20.5M This issue's mechanism: Prior-authorization denial rate of 4 percent (lowest among Big 5 per KFF), but Carelon-owned practice networks capture up to a 61 percent concentrated-market premium in affected geographies (Health Affairs 2025). AI-driven PA decisions reached 22 percent adoption. The low headline denial rate masks the vertical-integration extraction that has replaced denial as the dominant margin lever.
Who Profits: Cigna Group (CI) FY2024 Revenue: $247.1B | Operating Margin: 5.3% | CEO Comp (David Cordani): $23.3M | Stock Buybacks (2020-24): ~$29B | Lobbying (2020-24): ~$44M This issue's mechanism: Strategic exit from Medicare Advantage is underway (sale of MA book to HCSC, announced January 2024). Profit now concentrates in the Evernorth pharmacy-services arm, which captures PBM margin through the same vertical integration playbook UnitedHealth and Optum run on the medical side. MLR of 87.2 percent (CMS MLR PUF 2024).
Who Profits: Humana Inc. (HUM) FY2024 Revenue: $111.9B | Operating Margin: negative (MA segment operating loss) | CEO Comp: $16.8M This issue's mechanism: Six percent prior-authorization denial rate across 32 MA contracts (CMS-0057-F), but the lowest appeal-initiation rate of the Big 5 at 2.7 percent of denied claims (compared to UnitedHealth's 8.7 percent), suggesting the appeal process is structurally harder to navigate. Of those who do appeal, Humana overturns 64.7 percent, the highest overturn rate of any insurer in the dataset. Enrollee-level data shows appeals volume is suppressed, not clinical disagreement.
Sources: UnitedHealth Group 10-K and DEF 14A proxy; CVS Health 10-K; Elevance Health 10-K; Cigna Group 10-K; Humana Inc. 10-K (all SEC EDGAR FY2024); CMS CY2024 Part C Prior Authorization Reporting Data; CMS-0057-F Prior Authorization Transparency Disclosures (April 2026); KFF Medicare Advantage analysis (2024-2025); Health Affairs November 2025 (Optum vertical integration premium study); CMS Medical Loss Ratio Public Use File 2024; DOJ Antitrust Division filings; OpenSecrets.org federal lobbying disclosure database (2020-2024); company cash flow statements.
The Fix
Immediate: Prior Authorization Reform (care suppression and automated denials)
Establish federal standards for prior authorization. The CMS Prior Authorization Final Rule (effective January 1, 2026) sets the framework: 72-hour turnaround for expedited requests, 7 days for standard. Expand this with:
- Mandatory written clinical justification for any denial. Replace boilerplate "not medically necessary" with a requirement that the insurer cite the specific evidence-based guideline the request fails to meet.
- Automatic approval if the deadline passes. If the insurer doesn't respond within the regulatory window, the request is approved. This inverts the default: the insurer bears the cost of delay, not the patient.
- Ban AI from making adverse PA determinations without human clinician review. Minnesota's HF2500 (2026) has the right structure. Expand it federally. Require AI decision rationale to be disclosed to the patient and physician.
- Gold-carding for low-denial physicians. Physicians with overturn rates above 80 percent on appeals should be exempt from prior authorization for those service categories.
Medium-Term: Vertical Integration Limits (Component B)
Prohibit insurers from paying owned providers more than 105 percent of Medicare rates for equivalent services. This removes the margin advantage of vertical integration without banning it. California's SB 1039 (2024) attempted a version of this; a federal standard with enforcement teeth would apply it at scale.
Alternatively, require strict operational independence: separate management, separate P&L reporting, and arm's-length pricing between insurance and provider divisions, using the same firewall standards from the Medicare Advantage anti-kickback statutes.
Long-Term: MLR Enforcement and Risk Adjustment Audits
Tighten the definition of "quality improvement expense" for MLR purposes. Eliminate three-year averaging. Require granular administrative cost reporting. The 80 percent floor was designed to align incentives; the gaming undermines it.
Audit MA risk adjustment coding annually (HHS OIG recommendation, October 2024). Recover overpayments with penalties for undocumented diagnoses.
Who Has the Power
Congress: Pass federal PA standards (72-hour turnaround, written justification, gold-carding). Regulate vertical integration pricing. Strengthen MLR definitions.
HHS/CMS: Redefine MLR administrative categories (executive action). Audit risk adjustment coding. Issue arm's-length pricing guidance for insurer-owned providers.
FTC/DOJ: Continue the UnitedHealth investigation. Expand to CVS, Elevance, and Cigna vertical integration practices.
States: Seven states have restricted AI in PA. Twenty states have PA response time standards. Colorado, California, and Minnesota are leading.
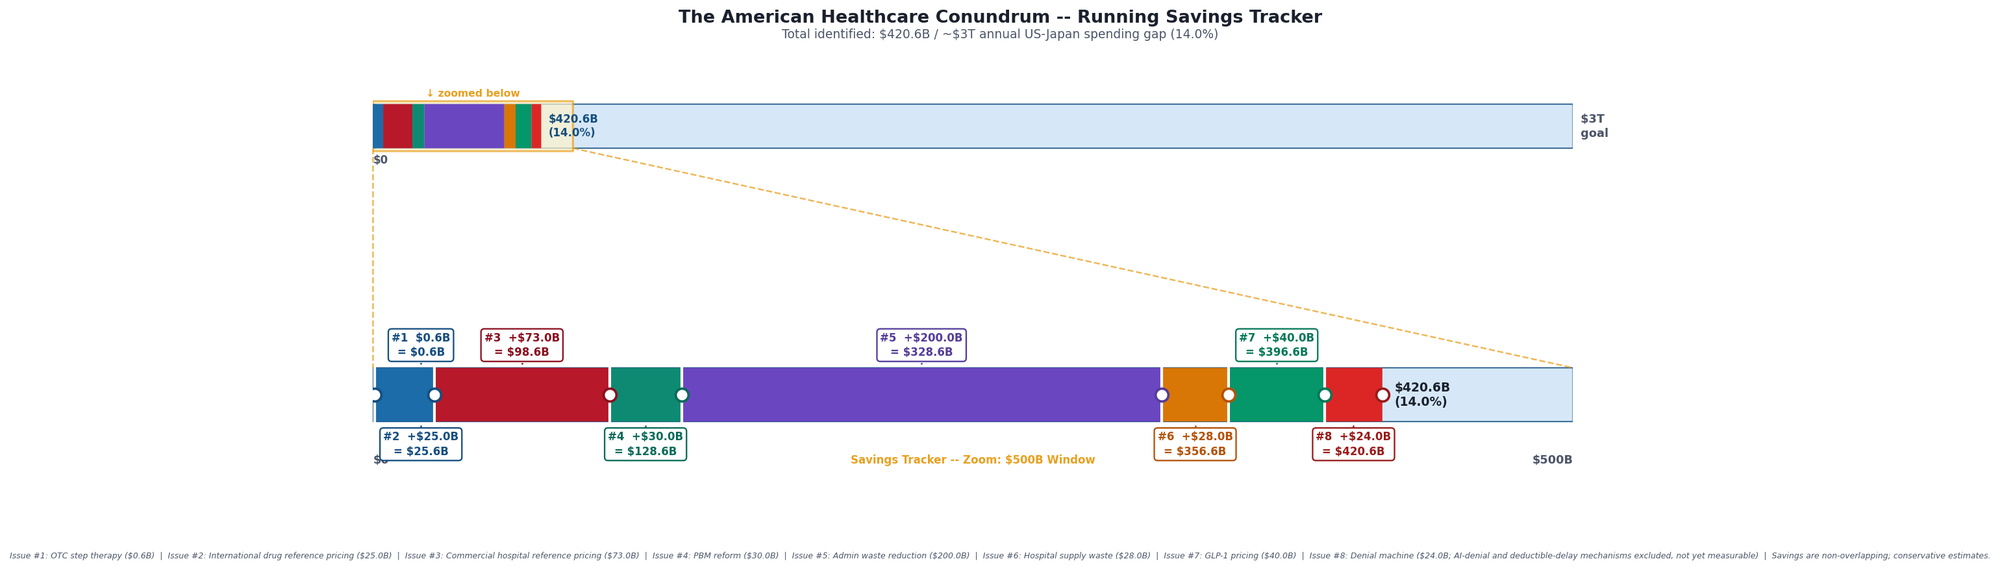
Savings Tracker: $420.6 Billion and Counting
Running total after Issue #8: $420.6 billion per year in recoverable waste across all issues published to date.
Expressed as a percentage of the $3 trillion annual U.S. healthcare spending gap between the United States and Japan: 14.0 percent.
Methodology notes:
Issue #1 OTC: $0.6B from Medicare Part D step-therapy reform. Issue #2 Drug Pricing: $25.0B from international price normalization (net of rebate adjustment). Issue #3 Hospital Pricing: $73.0B from commercial reference pricing (capping insurer payments at 200% of Medicare). Issue #4 PBMs: $30.0B from rebate pass-through and formulary transparency. Issue #5 Admin Waste: $200.0B from standardized billing, automated PA, and payer rate-setting. Issue #6 Supply Waste: $28.0B from hospital supply cost variance (Q4 to P75 within peer groups). Issue #7 GLP-1: $40.0B from price negotiations and volume optimization in the permanent BALANCE model. Issue #8 Denial Machine: $24.0B from prior authorization reform ($10.4-17.0B care suppression), vertical integration restrictions ($6.7-13.8B margin arbitrage), and MA risk adjustment audits ($0.3B). Booked at $24B within a $17-31B range. Two further mechanisms are excluded from the booked total: the rise in automated (AI) denials, whose direction is documented but whose national dollar value has never been measured, and deductible-delay extraction (the MRI vignette), which requires matched patient-level claims and deductible-exposure data we are actively seeking through the AHC Data Access Fund. We expect both to add materially to the total in a future issue.
What's Next
Issue #9: The Employer Trap. 65% of covered workers are in self-insured ERISA plans. Over the past decade, family premiums rose ~47% while wages rose ~30%. The same 45-year-old knowledge worker costs different employers wildly different amounts, and most employers don't know why. Issue #9 builds a per-employee variance analysis across firms of the same size (KFF EHBS + MEPS-IC), decomposes the wage-premium crossover, and books the slice that doesn't overlap with what Issues #3, #4, and this one already counted. Target: $40 billion a year in excess the employer system transmits straight into wages, before we start adding the pieces we can't see yet.
Every script is on GitHub. Every number can be verified. If you think we got something wrong, open an issue: github.com/rexrodeo/american-healthcare-conundrum
The AHC Data Access Fund. Every component in this issue was computed from public federal data: no paywall, reproducible, independently verifiable. That strength is also the ceiling. Component D, the deductible-delay extraction from the MRI vignette, is excluded from the booked total because measuring it cleanly requires matched patient-level claims and deductible-exposure data. We are crowdfunding access to six datasets that close this gap: CMS Medicare 5% sample, Colorado APCD, AHRQ HCUP (CA + NY), Turquoise Health full price transparency, Midpage legal research, and the CMS Virtual Research Data Center (100% Medicare, 65 million patients). Three phases. $44,200 goal. Any amount from $5. Pick a specific dataset, see what it unlocks, watch the progress bar move. Every dollar buys data, not salary. Every sponsor named or anonymous. Organizations with proprietary dataset access (Truven/MarketScan, Optum Clinformatics, IQVIA Pharmetrics, Definitive Healthcare) or active DUAs can collaborate directly. Visit the fund: ahcdata.fund
If you found value in this work, forward it to someone who should see it.
Sources: CMS-0057-F Prior Authorization Transparency Rule disclosures (April 2026) covering 61 UnitedHealthcare MA contracts and 32 Humana contracts; CMS Monthly Enrollment by Plan (March 2026), 35.6 million MA enrollees across 7,606 plans; KFF CY2024 Medicare Advantage Prior Authorization reporting: insurer-level denial rates, appeal rates, overturn rates for 7 major insurers; KFF ACA Marketplace 2024 Working File: 2,540 plans, 374 million claims, 75.9 million denials; KFF Medicare Advantage Historical PA data (2019-2024); KFF Medical Loss Ratio Rebates (kff.org, 2024 rebate and cumulative-since-2012 figures); KFF Employer Health Benefits Survey 2025; CMS Medical Loss Ratio Public Use Files (2019-2024); CMS National Health Expenditure Accounts 2023; Peterson-KFF Health System Tracker (deductible share of out-of-pocket); Arnold/Fulton 2025, "UnitedHealthcare Pays Optum Providers More Than Non-Optum Providers" (Health Affairs 44(11):1395-1403, DOI 10.1377/hlthaff.2025.00155); Wang/Meiselbach/Cox/Anderson/Bai 2023, "The Relationships Among Cash Prices, Negotiated Rates, And Chargemaster Prices For Shoppable Hospital Services" (Health Affairs 42(4):516-525, DOI 10.1377/hlthaff.2022.00977); Brot-Goldberg/Chandra/Handel/Kolstad 2017, "What Does a Deductible Do?" (QJE 132(3):1261-1318); HCCI / Frost/Newman 2016, "Spending on Shoppable Services in Health Care" (Health Care Cost Institute); npj Digital Medicine 2026, "Medicare advantage becoming a disadvantage with use of artificial intelligence in prior authorization review" (nature.com/articles/s41746-026-02387-x); U.S. Senate Permanent Subcommittee on Investigations, "Refusal of Recovery" report (Oct 2024); Lokken v. UnitedHealth Group (D. Minn., motion to dismiss denied Feb 2025); ProPublica 2023, Cigna PxDx reporting (propublica.org); AMA Physician Survey on Prior Authorization (2024); CMS-4201-F Medicare Advantage final rule (2024); HHS OIG, Medicare Advantage Risk Adjustment Audit (OEI-03-23-00380, Oct 2024); ADA 2024, "Economic Costs of Diabetes in the U.S. in 2022" (Parker et al., Diabetes Care 47(1):26-43); Bansal et al. 2022 (Diabetes Therapy 13(3)); Fung et al. 2023, PA-denial downstream costs in type-2 diabetes (JMCP); National Cancer Institute SEER Program (late-stage cancer cost); Center for American Progress and Georgetown CHIR on MLR quality-improvement reclassification; U.S. GAO 2018 (quality-improvement expense classification); FREOPP, "Gaming the Medical Loss Ratio"; CMS Hospital Price Transparency Final Rule (effective July 2022); UnitedHealth, CVS Health, Elevance Health, Cigna Group, and Humana 10-K and DEF 14A filings (SEC EDGAR, FY2024); OpenSecrets.org federal lobbying disclosure (2020-2024); Minnesota HF2500 (2026).
Correction (July 2026): During a routine re-verification of sources, two citations in the original version of this issue could not be verified and have been removed: a claimed American Journal of Managed Care 2023 review of care-delay costs and a claimed JAMA Health Forum 2024 estimate of medical-loss-ratio "gaming" dollars. The care-suppression figure was re-sourced to peer-reviewed diabetes-cost and prior-authorization studies (its dollar value is unchanged), and the MLR passage now cites the GAO, Center for American Progress, Georgetown CHIR, and FREOPP with correctly labeled KFF rebate figures. Separately, the AI-denial component was removed from the booked total: the direction of the effect is well documented, but no measured national dollar figure exists, so quantifying it is now an explicit data-partner ask rather than a booked number. As a result the booked total for this issue was restated from $32 billion to $24 billion, and every running total from Issue #8 forward moves down $8 billion. The full audit is on GitHub.
Savings Tracker (consolidated):
$420.6 billion per year in identified, booked, and recoverable waste across eight published issues of The American Healthcare Conundrum.
The $3 trillion annual spending gap between the United States and Japan per-capita healthcare costs remains the north star. Every dollar identified is independently defensible through published research, federal datasets, or peer-reviewed analysis. No speculation. No attribution without source. The analysis uses only public data.
The American Healthcare Conundrum publishes when the data is ready. All analysis uses publicly available data. Code is open-source. Figures are validated before publication.
Get every issue in your inbox
The American Healthcare Conundrum is free. One fixable problem in U.S. healthcare, with the data, every week.