Issue #17: The Part B Pharmacy Premium
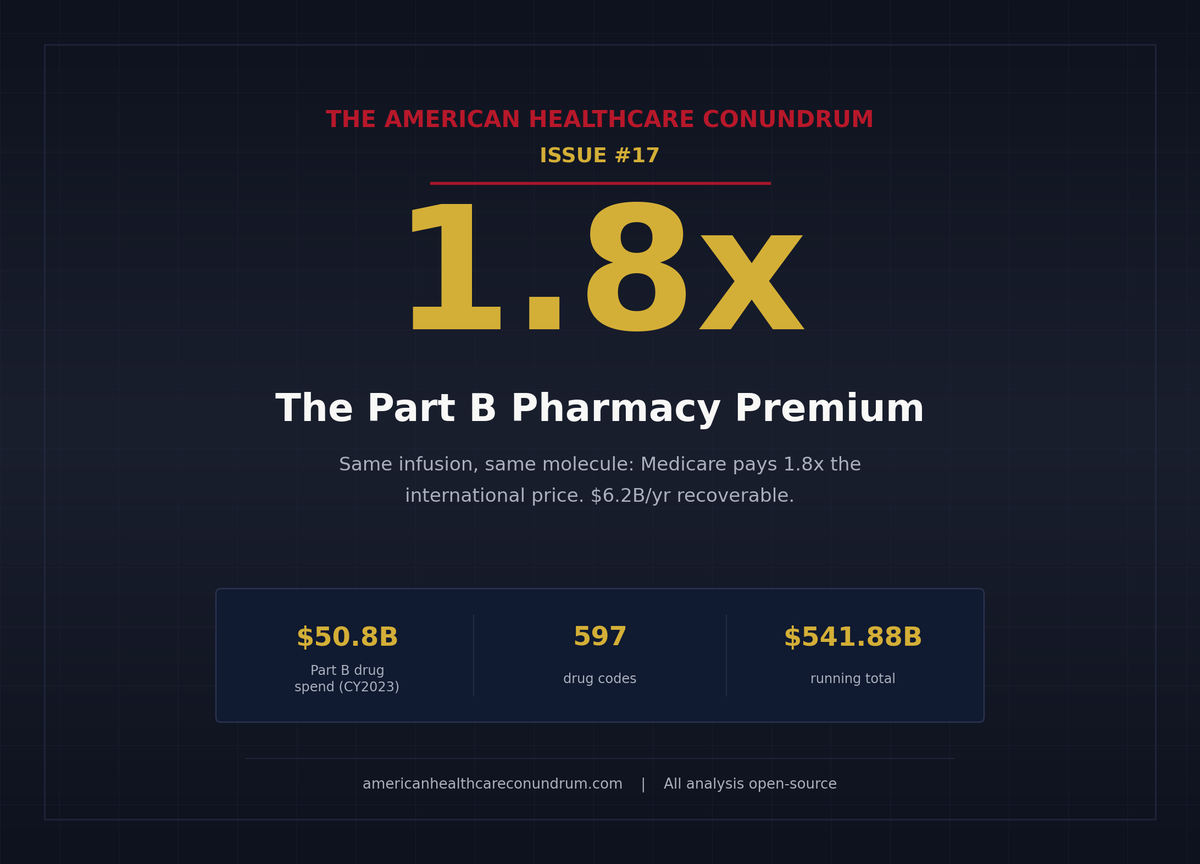
How Medicare Part B pays 1.8 times the international price for physician-administered biologics, generating $6.2 billion per year in recoverable savings
Each issue of The American Healthcare Conundrum identifies one fixable problem in U.S. healthcare spending, builds the data case, and recommends a specific policy fix. All analysis uses publicly available data. Code is open-source.
Target: ~$3.24T US-Japan per-capita spending gap
(Japan: highest life expectancy, lowest infant
 mortality in OECD, ~half US per-capita spend)

Full scale: $0 ─────────────────────────── $3.24T
            █████░░░░░░░░░░░░░░░░░░░░░░░░  16.7%
            ↑ $541.88B identified

Per-issue savings (1 block ≈ $8B; max bar = $200B):
 #1 ▏                          $0.6B   OTC Drug Overspending
 #2 ███                       $25.0B   Drug Pricing
 #3 █████████                 $73.0B   Hospital Pricing
 #4 ████                      $30.0B   PBM Reform
 #5 █████████████████████████ $200.0B  Admin Waste
 #6 ███                       $28.0B   Supply Waste
 #7 █████                     $40.0B   GLP-1 Pricing
 #8 ████                      $32.0B   Denial Machine
 #9 █                          $6.6B   Employer Trap
#10 █                          $7.6B   Procedure Mill
#11 ████                      $28.0B   MA Overpayment
#12 ██                        $13.0B   Consolidation Tax
#13 █                          $5.4B   Nonprofit Lie
#14 ████                      $27.6B   Specialist Tax
#15 ▏                          $2.55B  Facility Fee Scam
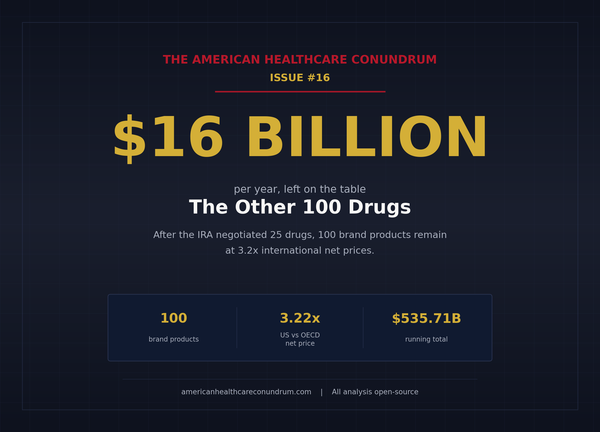
#16 ██                        $16.4B   The Other 100 Drugs
#17 █                          $6.2B   Part B Pharmacy Premium (this issue)
   ──────────────────────────────────────────────────
   Total: $541.88B  ·  $2,698.12B remaining
   Scale: $3.24T (CMS NHE 2024; Japan OECD 2023)
Two infusion chairs. Same biologic. Identical molecule, identical dose, identical vein.
In a US oncology clinic, a Medicare patient receives pembrolizumab (Keytruda) for non-small cell lung cancer. At the standard 200 milligram dose and the current Average Sales Price (ASP), the drug ingredient alone costs Medicare roughly $11,000 per infusion. Across all of Medicare, Keytruda is the single largest drug expenditure in the entire program, at $5.4 billion in 2023. In a German or British infusion suite, the same molecule infuses at a fraction of that ingredient price.
Issue #16: The Other 100 Drugs covered what the Inflation Reduction Act (IRA) left behind in Medicare Part D, the pharmacy benefit. Issue #17 turns to a separate Medicare program that the IRA does not reach until 2028: Medicare Part B, which pays for physician-administered drugs. These are not pills picked up at a retail pharmacy. They are oncology biologics, infused autoimmune therapies, and intravitreal eye injections, given by a provider in an office or hospital outpatient department, billed under a J-code, and reimbursed at the ASP plus a 6 percent add-on.
The result: $6.2 billion per year in recoverable savings (range $2.9B to $14.1B).
The Universe and the Gap
Start with everything Medicare Part B paid for drugs in 2023. The Centers for Medicare and Medicaid Services (CMS) spending file lists 734 drugs, $50.79 billion in all. A few groups do not belong in an international price comparison, so they come out first: skin-graft products ($3.64 billion), which have no clean overseas equivalent; vaccines ($2.50 billion), which countries buy through bulk government tenders; and immune and blood products ($2.86 billion), commodities whose overseas prices are hard to match cleanly. GLP-1 weight-loss and diabetes drugs are not paid under Part B at all (they ran in Issue #7: The GLP-1 Gold Rush). What remains is $41.8 billion across 597 brand-name drugs and biologics that face no direct competitor.
One more adjustment matters. When a brand-name biologic loses patent protection, cheaper copycat versions (called biosimilars) reach the market, and they already sell at close to international prices. Counting those as overpriced would overstate the problem, so we set their gap to zero. Medicare gives biosimilars their own billing codes, which made the $1.4 billion in biosimilar spending easy to find and remove. A few genuinely new brand-name drugs with no competitor yet (Darzalex Faspro, Vabysmo, Ultomiris) look similar but are not biosimilars, so they keep the full gap. After removing the biosimilars, $39.7 billion of spending still carries a price gap.
Computing the Gap
The US price in this comparison is the Average Sales Price (ASP). By law it is the average of what manufacturers actually collect after their discounts and rebates (Social Security Act Section 1847A(c)(3)), so it is a real transaction price, not a sticker price. And for these clinic-administered drugs, rebates are rare (RAND, 2024), so that real price sits close to the list price anyway.
The international side is harder. What other countries actually pay for these patented biologics, after their own confidential discounts, is not published anywhere we can reach it (the UK's open database covers generics only; the German and EU databases show list prices, not the negotiated net). No country publishes a clean apples-to-apples net price for this category, which is the main data request we make below.
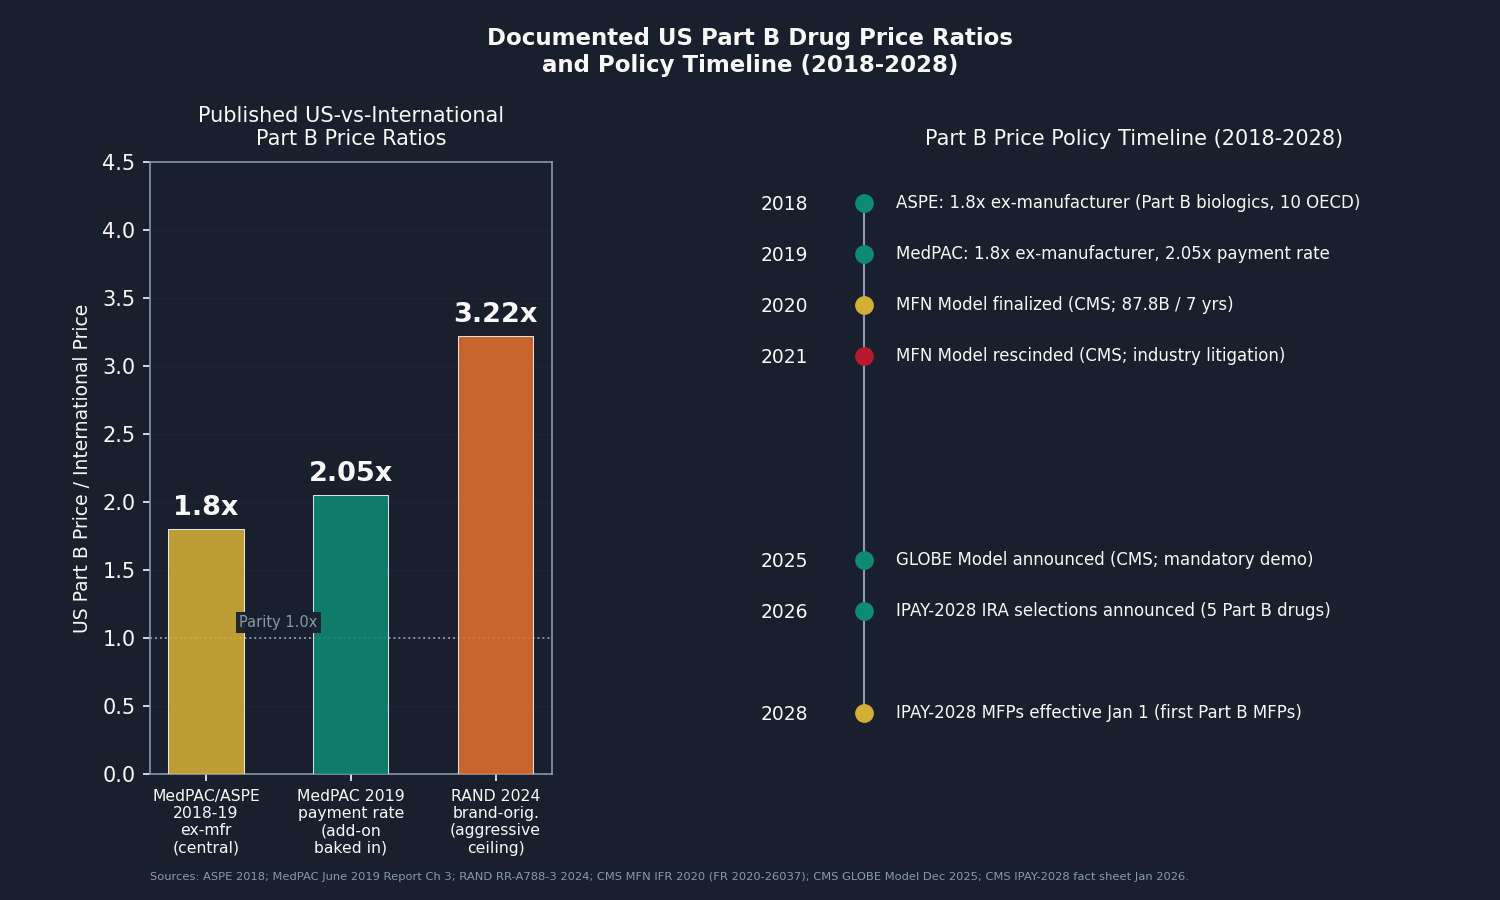
So we use the next-best published number: how much more the US pays at the factory gate (the "ex-manufacturer" price, before any markups) for Part B drugs specifically. Two federal analyses landed on the same answer independently. The Medicare Payment Advisory Commission (MedPAC) in 2019 and the federal health department's policy office (ASPE) in 2018 both found the US pays about 1.8 times the international average for these drugs. Because both looked at exactly this category, and Part B is roughly four-fifths biologics, 1.8 times is our central estimate. RAND's higher figure of 3.22 times comes from a broader basket of brand drugs and compares a US after-discount price against international sticker prices, so we keep it only as an aggressive ceiling, not the headline.
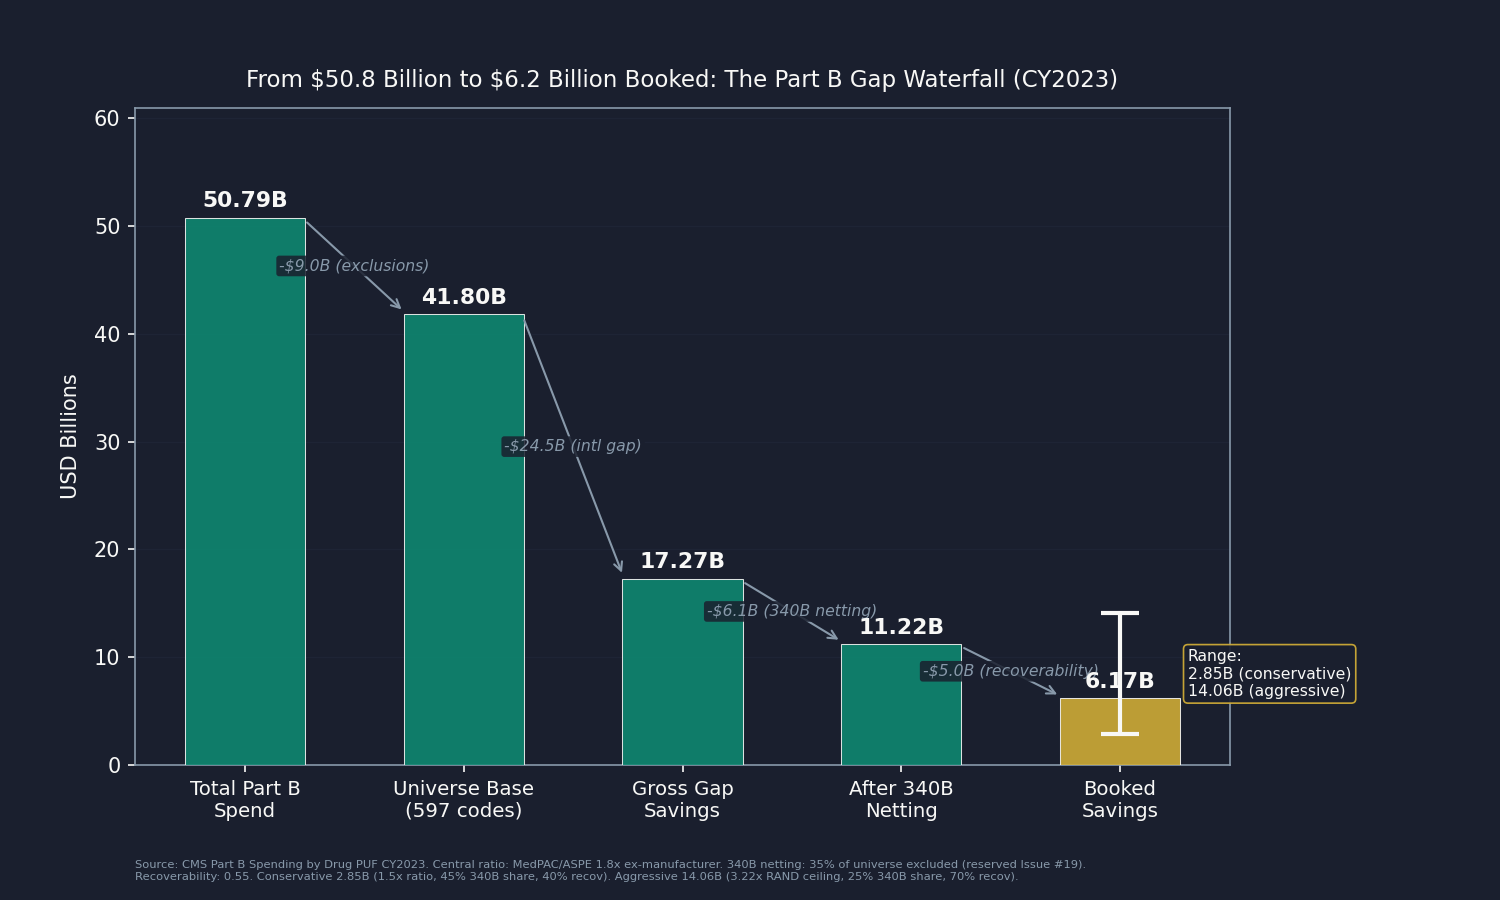
The waterfall, step by step:
- $50.79B total separately-paid Part B drug spend (734 codes)
- minus $9.00B excluded (skin substitutes, vaccines, immune globulins)
- equals $41.80B universe spend base (597 codes)
- times 0.444 (the share of that spend that is overpayment at a 1.8x gap, after zeroing biosimilars and half-counting drugs that already faced competition in 2023)
- equals $17.27B gross gap savings
- times 0.65 non-340B share
- times 0.55 recoverability
- equals $6.17 billion booked
Two of those steps need a word. The 340B Drug Pricing Program lets qualifying hospitals and clinics acquire certain drugs at deep discounts, typically 22.5 to 28.7 percent below ASP per MedPAC analysis. That domestic acquisition spread is a separate mechanism reserved for an upcoming issue (Issue #19), so this analysis books only the international gap on the non-340B portion (an estimated 65 percent of the universe, from MedPAC and Government Accountability Office (GAO) aggregates). Recoverability is set at 0.55, reflecting the contested history of Part B international reference pricing: the Most Favored Nation (MFN) model was finalized in November 2020 and rescinded by CMS in December 2021 before it ever took effect, and the GLOBE model (Global Benchmark for Efficient Drug Pricing), announced December 19, 2025, covers only a portion of Part B utilization. Clinics that buy and bill these drugs also have a direct financial stake in resisting reform, since their percentage markup shrinks whenever the drug's price falls.
The Mechanism: A 6 Percent That Points the Wrong Way
Buy-and-Bill and the Percentage Add-On
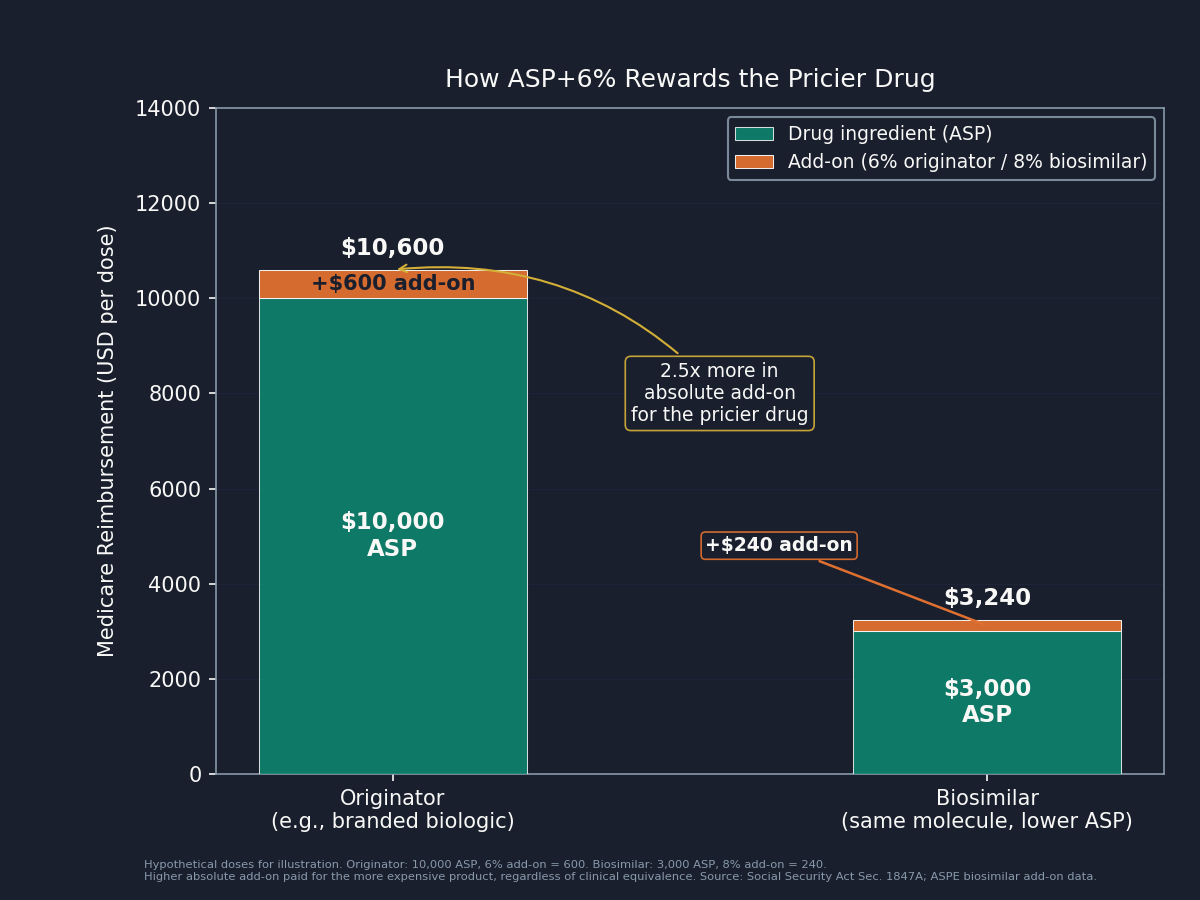
When a physician's office or hospital outpatient department administers a Part B drug, it buys the drug first and then bills Medicare the ASP plus 6 percent (the 2 percent Medicare sequester trims the effective add-on to about 4.3 percent). This is buy-and-bill: the clinic captures both the administration service and the drug's margin. Because the add-on is a percentage, a more expensive drug pays the provider more in absolute dollars than a cheaper one that does the same job. A $10,000 drug earns the provider $600; a $2,000 biosimilar equivalent earns $120. The incentive is built into the arithmetic, and Jacobson/Earle/Price/Newhouse (Health Affairs, 2010) documented that oncologists shifted drug selection in response to reimbursement changes after the 2005 ASP rule took effect.
The clearest current example is Eylea (aflibercept, J-code J0178), the second-largest Part B drug at $3.15 billion in 2023. Its exclusivity ended in May 2024, and several biosimilar versions received Food and Drug Administration (FDA) approval after patent-litigation delays. Congress even gave biosimilars a temporarily elevated 8 percent add-on for five years from October 2022 to encourage substitution (ASPE). Yet branded Eylea held meaningful market share, because the 6 percent add-on on the higher originator ASP still pays the retina specialist more in absolute dollars than the 8 percent add-on on the lower biosimilar ASP. MedPAC has documented this dynamic since at least 2016.
The villain here is not the retina specialist. A clinician responding rationally to how Medicare pays is not acting badly. The villain is a percentage add-on designed for a world where biosimilar competition did not exist for high-cost biologics. The same pressure operates internationally in reverse: a German or British physician works under a procurement framework where the purchasing authority negotiates the net price directly, so the provider does not benefit from paying more.
One framing note. This analysis compares the US price of an already-approved drug against the price of the identical drug in peer countries. It is not a claim about whether any drug is clinically worth its price: the same manufacturer sells the same molecule abroad at the lower net price and markets it profitably. Access and clinical value are separate questions.
Who Profits
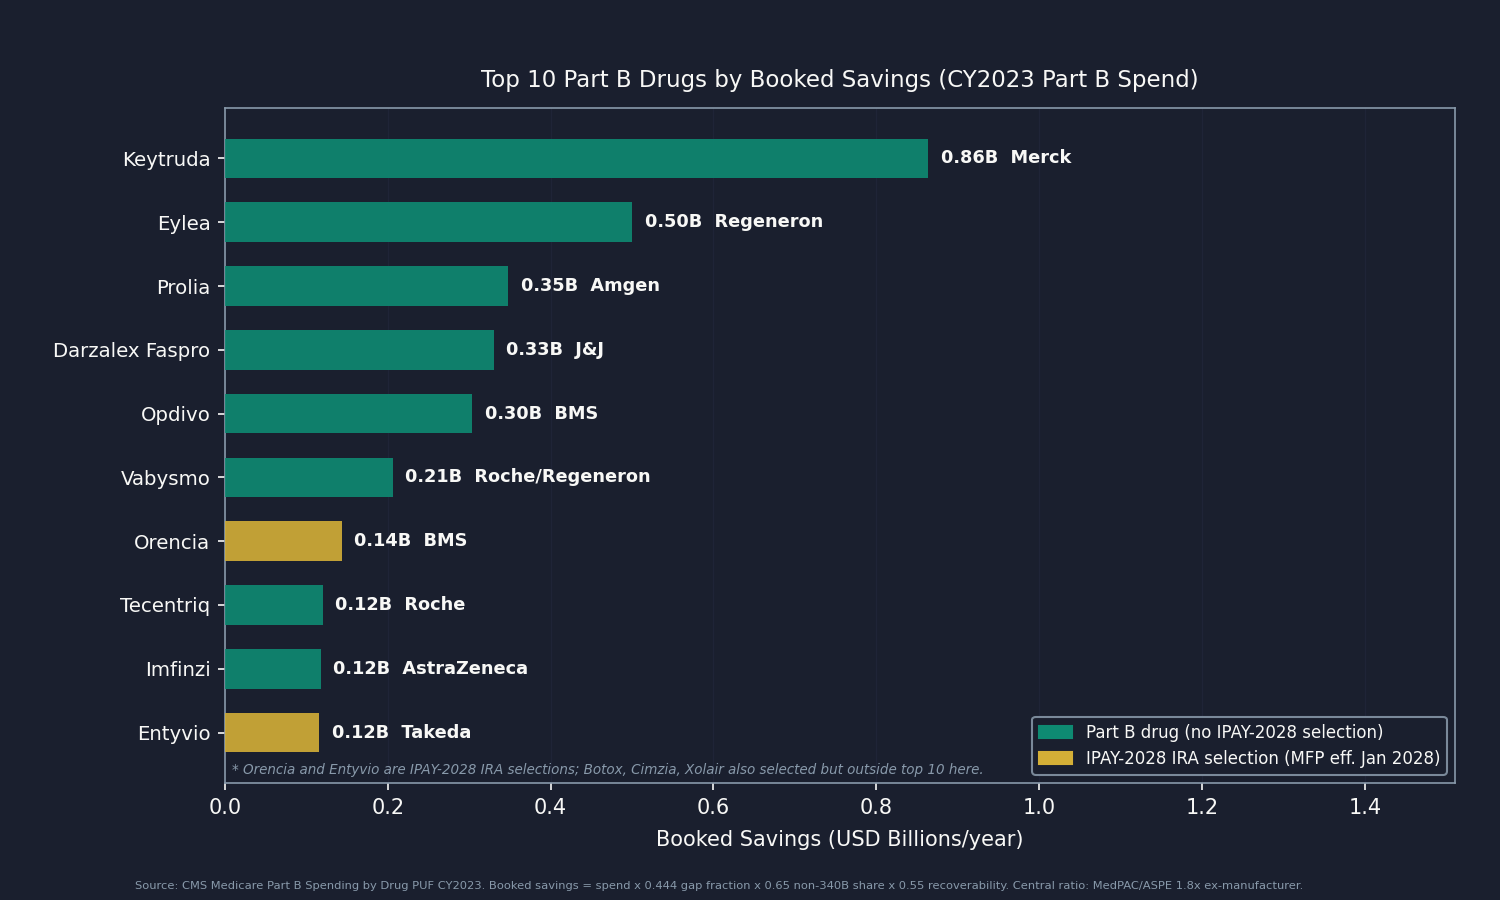
Merck (MRK) FY2024 Revenue: $64.2B | Operating Margin: ~31% (GAAP operating income $19.9B) | CEO Comp (Robert M. Davis): $23.2M This issue's mechanism: Keytruda (pembrolizumab, J9271) is the single largest separately-paid Part B drug in Medicare at $5.43 billion in CY2023, 10.7 percent of all such spend, and roughly 46 percent of Merck's FY2024 revenue ($29.5 billion globally). Medicare's ASP-plus-add-on system sets no ceiling relative to international reference prices, so Merck prices Keytruda to the US market without an international constraint, and the gap between US ASP and OECD ex-manufacturer prices accounts for $0.86 billion of the $6.2 billion booked here. The molecule's patent runs through 2028, so the IPAY-2028 IRA negotiation is the first mechanism that will apply a negotiated price to any Part B claim for it.
Sources: Merck FY2024 Form 10-K and DEF 14A via SEC EDGAR (CIK 0000310158); CMS Part B PUF CY2023; OpenSecrets.org (2020-2024).
Regeneron (REGN) FY2024 Revenue: $14.2B | Operating Margin: ~29% (operating income ~$4.17B) | CEO Comp (Leonard Schleifer): $6.8M (FY2024 carried no new equity award under a multi-year grant cycle) This issue's mechanism: Eylea (aflibercept, J0178) is the second-largest Part B drug at $3.15 billion in CY2023 and the buy-and-bill biosimilar-adoption case described above. US ex-manufacturer ASP runs about 1.8 times OECD peers (MedPAC/ASPE), contributing $0.50 billion to the booked total. Because Eylea's biosimilars launched only in May 2024, the CY2023 anchor captures it as a monopoly originator carrying the full gap. Regeneron also co-develops Vabysmo (faricimab-svoa, J2777) with Roche, the sixth-largest Part B drug at $1.30 billion.
Sources: Regeneron FY2024 Form 10-K and DEF 14A via SEC EDGAR (CIK 0000872589); CMS Part B PUF CY2023; OpenSecrets.org (2020-2024).
Bristol Myers Squibb (BMY) FY2024 Revenue: $48.3B | Operating Margin: not meaningful on a GAAP basis (a ~$12.1B Acquired In-Process R&D charge from the Karuna acquisition pushed GAAP operating income to a loss; GAAP gross margin 71.1%) | CEO Comp (Christopher Boerner): $18.8M This issue's mechanism: Bristol Myers Squibb holds three products in the universe: Opdivo (nivolumab, J9299) at $1.91 billion in CY2023 spend ($0.30B booked), Yervoy (ipilimumab, J9228) at $0.46 billion ($0.07B booked), and Reblozyl (luspatercept-aamt, J0896) at $0.45 billion ($0.07B booked), together $0.45 billion of the booked total. Opdivo, like Keytruda the single largest Part B drug, is a checkpoint inhibitor, a class whose international procurement prices manufacturers hold confidential in reference-price negotiations with national health systems.
Sources: Bristol Myers Squibb FY2024 Form 10-K and DEF 14A via SEC EDGAR (CIK 0000014272); CMS Part B PUF CY2023; OpenSecrets.org (2020-2024).
A note on Roche/Genentech. Roche is the fourth-largest manufacturer by booked savings here (~$0.49B), with five products including Vabysmo, Tecentriq, Ocrevus, and the biosimilar-available originators Avastin and Rituxan. As a Swiss company it files an Annual Report rather than a US Form 10-K, so it is described in prose: the 2024 Annual Report reports Group FY2024 sales of CHF 51.9 billion (~$57.7B) and a pharmaceutical-division operating margin of approximately 29.9 percent.
A note on institutional buy-and-bill. Large hospital systems and 340B disproportionate-share hospitals also earn buy-and-bill margin: the 6 percent add-on on the US ASP, plus, for 340B-acquired volume, the spread between discounted acquisition cost and full ASP reimbursement (the 340B spread is quantified in the upcoming Issue #19). The non-340B margin is the provider-side reflection of the same percentage add-on, a payment design that scales with the drug price rather than the cost of administering it.
The Fix
Four levers address the Part B price premium, in approximate order of implementation friction.
Lever 1: Let IRA Part B negotiation reach these drugs. The IRA's framework opened to Part B drugs for the first time in January 2026, when CMS selected five (including Orencia/abatacept, Entyvio/vedolizumab, and Botox/onabotulinumtoxin A, $2.9 billion of universe spend) for IPAY 2028 negotiation, with Maximum Fair Prices effective January 1, 2028. Applying the framework to more Part B drugs in later cycles needs no new legislation, only CMS prioritization against per-cycle selection limits. This is the lowest-friction lever.
Lever 2: Replace ASP+6% with a flat add-on. MedPAC has recommended a fixed flat dollar amount per administration since at least 2016. A flat fee would not address the US-vs-international price level, but it would remove the advantage the current design confers on higher-priced originators over biosimilars. CMS cannot change the formula on its own; it is set by statute (Social Security Act Section 1847A(b)(1)), so Congressional action is required.
Lever 3: Least-costly-alternative for biosimilar-available originators. Where an FDA-approved biosimilar exists, CMS could reimburse the originator at the biosimilar's ASP rather than its own, paying the provider equally for both. Eylea is the clearest case: multiple biosimilar aflibercept versions exist, yet the originator reimburses at a higher ASP. This requires CMS rulemaking, not legislation, though the agency would face manufacturer litigation.
Lever 4: International reference pricing (the most contested). The MFN model (finalized November 2020, rescinded December 2021) would have tied the top 50 Part B drug prices to an international index; CMS projected $87.8 billion in government savings over 7 years before industry litigation ended it. The GLOBE model announced December 2025 revives a narrower mandatory demonstration with a multi-year phase-in. The core industry objection, that reference pricing reduces US access or delays launches, is met by the fact that the 19 countries in the GLOBE comparator set already have rapid access at those lower prices. A full-universe rule, if it survived litigation, would capture the largest share of the booked $6.2 billion; a GLOBE-style demonstration captures a portion.
Who acts: CMS for Lever 1 (drug selection) and Lever 3 (rulemaking). Congress for Lever 2 (ASP statute amendment) and, with the executive branch, Lever 4.
What's Next
Issue #18: Coding for Dollars publishes June 28. It examines the diagnostic coding practices that drive Medicare Advantage (MA) risk-adjustment payments above what the same patients would cost in traditional Medicare, building on Issue #11: The MA Overpayment.
Two data requests would sharpen this issue materially. First, per-molecule international net prices for patented Part B biologics. No symmetric net-to-net ratio is published for this channel, which is why the analysis applies the MedPAC/ASPE ex-manufacturer 1.8x class ratio as the central. A partner with EURIPID full access, national procurement net prices (NHS commercial framework, German GKV-Spitzenverband post-rebate), or a licensed IQVIA MIDAS international net dataset could replace the class ratio with per-molecule gaps, either confirming the $6.2 billion central or moving it. Second, the precise 340B-acquired share of each J-code, currently estimated from MedPAC and GAO aggregates. Mapping it per-drug requires JG/TB-modifier-tagged Part B claims (CMS Research Identifiable Files / Limited Data Set, restricted), which a research team with an active data use agreement could supply.
Reach out at contact@ahcdata.fund or ahcdata.fund.
Worked inside the system? We talk with people who have seen oncology practice or hospital pharmacy buy-and-bill purchasing, Part B drug contracting, ASP reporting, or 340B program administration from the inside. If you can help us understand how these processes actually work, or point us to documentation that does, we would value a conversation, on background and in confidence. Reach us at contact@ahcdata.fund.
All analysis code is at github.com/rexrodeo/american-healthcare-conundrum. If the math looks wrong, say so.
If this issue was useful, forward it to someone whose treatment is administered in a clinic, which is millions of people.
Sources: CMS Medicare Part B Spending by Drug PUF CY2023 annual release (data.cms.gov, dataset 76a714ad-3a2c-43ac-b76d-9dadf8f7d890); CMS Part B ASP reporting guidance and SSA 1847A(c)(3) (net-of-rebates definition; 340B and Medicaid rebates excluded from ASP); CMS Most Favored Nation Model IFR 2020 (Fed Reg 2020-26037); CMS GLOBE Model Dec 19, 2025 (cms.gov/priorities/innovation/innovation-models/globe); CMS IPAY 2028 selected-drug list and fact sheet, Jan 27, 2026 (cms.gov); MedPAC June 2019 Report Ch 3 (Part B payment 2.05x 19 OECD; ex-manufacturer 1.8x); MedPAC June 2022 Ch 4 (ASP/add-on payment; flat-add-on recommendation; biosimilar substitution); MedPAC April 2024 340B ceiling-price analysis (22.5%/28.7% discount anchors); RAND RR-A788-3 Mulcahy/Schwam/Lovejoy 2024 (DOI 10.7249/RRA788-3; brand-originator gross 422%, net over 3x); ASPE "Medicare Part B Drugs: Trends in Spending and Utilization 2008-2021" (biologics 78.9% of Part B; biosimilar 8% add-on); ASPE 2018 "Comparison of US and International Prices for Top Spending Part B Drugs" (1.8x); Jacobson/Earle/Price/Newhouse 2010 (Health Affairs 29(7), DOI 10.1377/hlthaff.2009.0563; oncologist drug selection responds to reimbursement design); Roche FY2024 Annual Report (roche.com/investor-relations); Merck FY2024 Form 10-K and DEF 14A proxy via SEC EDGAR (CIK 0000310158); Regeneron FY2024 Form 10-K and DEF 14A proxy via SEC EDGAR (CIK 0000872589); Bristol Myers Squibb FY2024 Form 10-K and DEF 14A proxy via SEC EDGAR (CIK 0000014272); OpenSecrets.org federal lobbying disclosure database (2020-2024); Center for Biosimilars, FDA aflibercept biosimilar approval reporting (centerforbiosimilars.com); GAO 340B drug pricing reports (gao.gov).
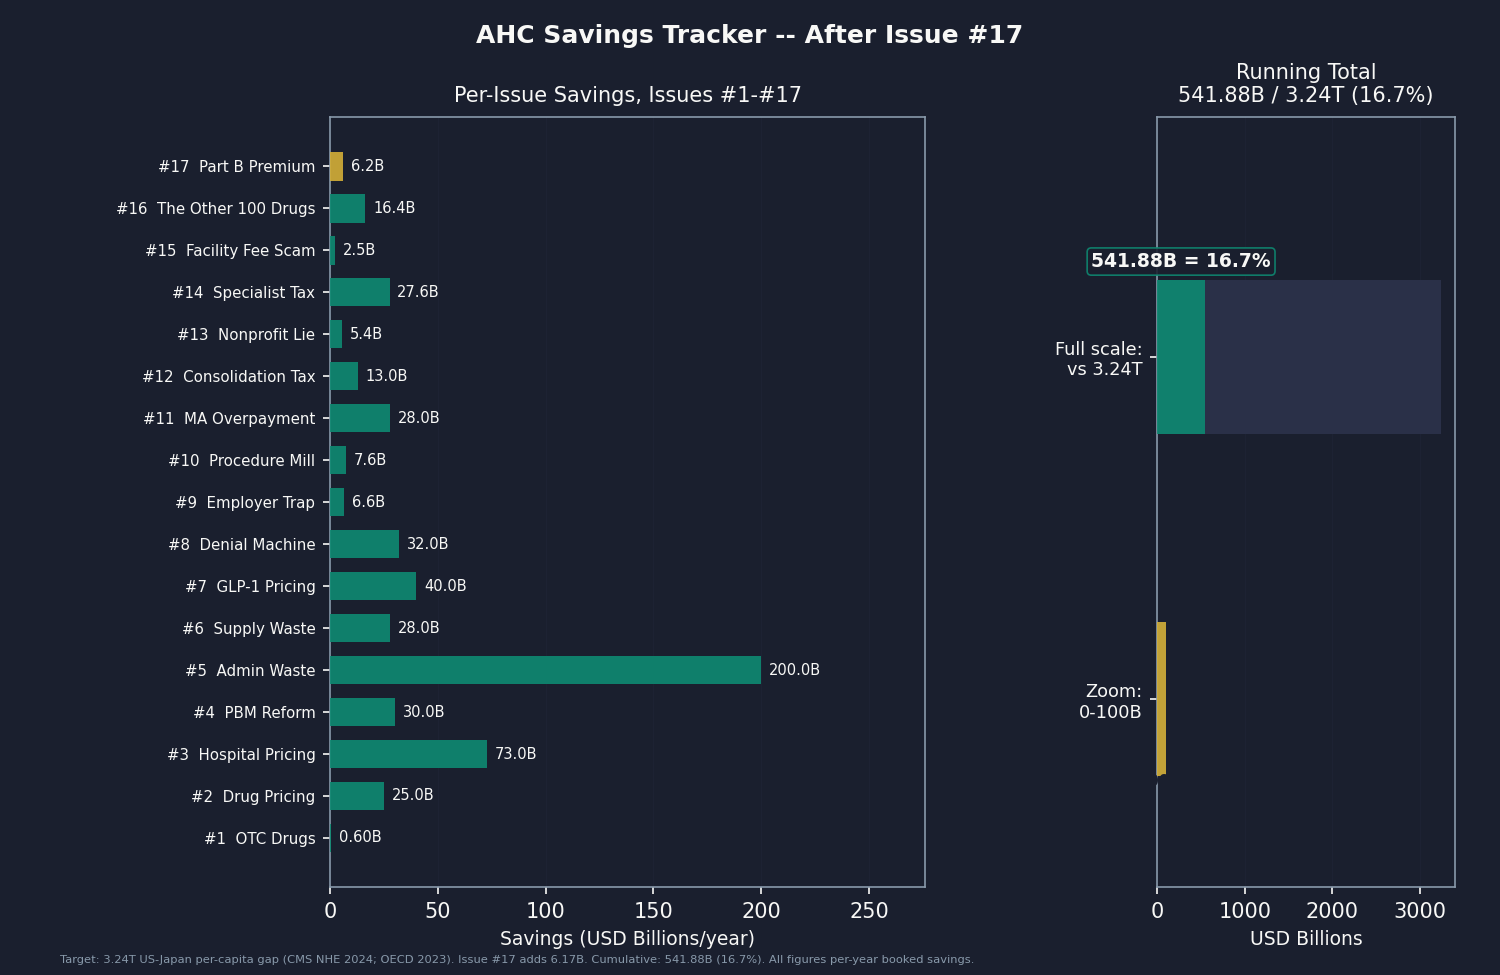
Running total after Issue #17: $541.88B / $3.24T (16.7%)
Methodology footnotes: Universe: CMS Medicare Part B Spending by Drug PUF CY2023 (734 HCPCS, $50.79B total separately-paid Part B spend), excluding skin substitutes (Q4xxx, 56 codes, $3.64B), vaccines (90xxx/91xxx and named vaccine brands, 34 codes, $2.50B), and immune globulins/blood products (47 codes, $2.86B). GLP-1 exclusion asserted empty (no semaglutide, tirzepatide, dulaglutide, or liraglutide present in Part B PUF). Universe: 597 codes, $41.80B spend base. International ratio: No symmetric net-to-net international price ratio is published for physician-administered Part B biologics; per-molecule international net prices for patented biologics are confidential (NHS eMIT generics-only; EURIPID/Lauer-Taxe gross list only; IFHP commercial-billed and short-listed). Central ratio: MedPAC June 2019 / ASPE 2018 ex-manufacturer 1.8x (gap fraction 0.444), the published Part-B-channel ratio from two independent federal analyses. RAND RR-A788-3 brand-originator 3.22x (US-net/international-gross asymmetric, retail-calibrated; gap fraction 0.689) is the aggressive ceiling only. Biosimilar-product correction: 27 Q5xxx HCPCS codes ($1.435B spend) carry gap_fraction = 0; these are biosimilar competitor products and the brand-originator ratio does not apply. Non-Q5 follow-ons (tbo-filgrastim/Granix J1447) also carry zero gap. Novel originator biologics with four-letter suffixes (Darzalex Faspro J9144, Vabysmo J2777, Ultomiris J1303, Enhertu J9358, Reblozyl J0896) are not Q5 codes and retain the full originator gap. True unbranded generics ($0.67B, 111 codes, normalized brand name equals normalized generic name) also carry zero gap. Biosimilar-competed-by-CY2023 originators (rituximab, bevacizumab, trastuzumab, pegfilgrastim, filgrastim, epoetin, darbepoetin, ranibizumab; 15 lines, $2.075B spend) carry a half-gap (0.5×); monopoly-priced-in-CY2023 originators (Eylea, Prolia, Soliris, plus ADCs Enhertu/Kadcyla/Phesgo) retain the full gap. Gap-bearing spend: $39.70B (95.0% of universe). Waterfall: $41.80B universe × 0.444 spend-weighted gap = $17.27B gross gap × 0.65 non-340B share = $11.22B × 0.55 recoverability = $6.17B booked. 340B netting: non-340B share 0.65 (central); 340B-acquired share 0.35 estimated from MedPAC/GAO aggregates (range 0.25 lower to 0.45 upper); this reserves the 340B acquisition spread for upcoming Issue #19. Recoverability: 0.55 central (range 0.40 lower to 0.70 upper), anchored to Part B international-reference-pricing context (MFN 2020 finalized/rescinded; GLOBE 2025 partial mandatory demonstration; buy-and-bill provider resistance; add-on friction carried here, not double-counted against base). IPAY-2028 sensitivity: five drugs in universe ($2.90B spend) are IPAY-2028 IRA negotiation selections; if excluded entirely, booked falls from $6.17B to $5.71B (7% effect; included in base at CY2023 pre-negotiation ASP). Scenarios: conservative $2.85B (ratio 1.5x, 340B share 0.45, recov 0.40); central $6.17B; aggressive $14.06B (ratio 3.22x, 340B share 0.25, recov 0.70). System-vs-program note: Total Spending in the PUF = Medicare program payment + beneficiary liability; the booked figure is a system-spend gap, not a federal-budget-savings figure (MFN/GLOBE figures are net federal program savings on different scopes). Overlap: Issue #2 and Issue #16 cover Part D pharmacy benefit; Part B is a mechanically separate program billed by J-code; no dollar double-count. Issue #7 GLP-1 drugs are pharmacy-dispensed Part D; not present in Part B PUF. Issue #15 facility-fee booked components (clinic visits + minor procedures) contain zero J-code drug ingredient spend; ingredient price is booked here and only here. Issue #19 (upcoming) books the domestic 340B acquisition spread on 340B-acquired Part B volume; reserved by construction via the 0.35 share removal; the project-level sum of #17 and #19 is less than the naive total (the international gap and 340B spread on 340B-acquired units partly target the same overpayment). Denominator: $3.24T US-Japan per-capita gap (CMS NHE 2024 final, OECD Health at a Glance 2025).
Cumulative after Issue #16: $535.71B. Issue #17 adds $6.17B. New cumulative: $541.88B.
The American Healthcare Conundrum publishes when the data is ready. All analysis uses publicly available data. Code is open-source. Figures are validated before publication.
Get every issue in your inbox
The American Healthcare Conundrum is free. One fixable problem in U.S. healthcare, with the data, every week.