Issue #16: The Other 100 Drugs
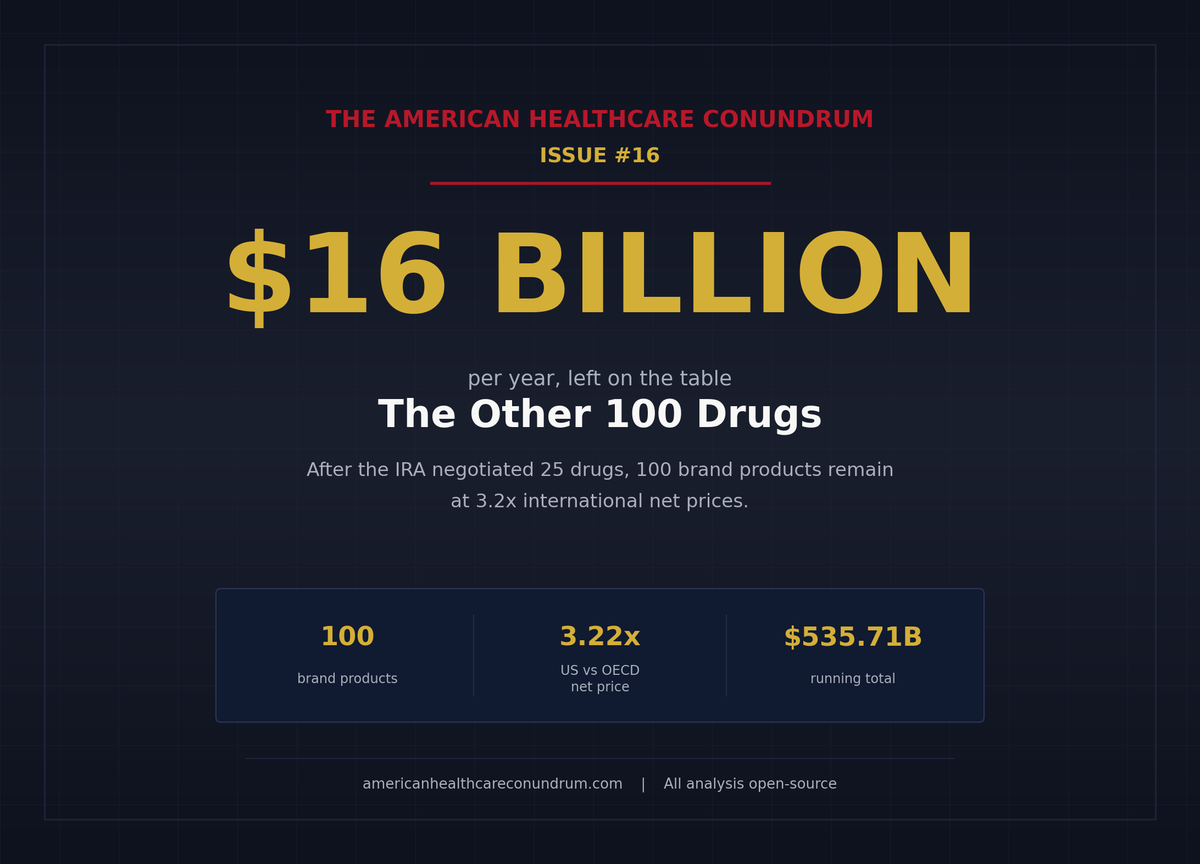
Medicare negotiated 25 drugs. The next 100 brand products carry the same international price gap, and roughly $16 billion a year in recoverable savings.
Each issue of The American Healthcare Conundrum identifies one fixable problem in U.S. healthcare spending, builds the data case, and recommends a specific policy fix. All analysis uses publicly available data. Code is open-source.
Target: ~$3.24T US-Japan per-capita spending gap
(Japan: highest life expectancy, lowest infant
 mortality in OECD, ~half US per-capita spend)

Full scale: $0 ─────────────────────────── $3.24T
            █████░░░░░░░░░░░░░░░░░░░░░░░░  16.5%
            ↑ $535.71B identified

Per-issue savings (1 block ≈ $8B; max bar = $200B):
 #1 ▏                          $0.6B   OTC Drug Overspending
 #2 ███                       $25.0B   Drug Pricing
 #3 █████████                 $73.0B   Hospital Pricing
 #4 ████                      $30.0B   PBM Reform
 #5 █████████████████████████ $200.0B  Admin Waste
 #6 ███                       $28.0B   Supply Waste
 #7 █████                     $40.0B   GLP-1 Pricing
 #8 ████                      $32.0B   Denial Machine
 #9 █                          $6.6B   Employer Trap
#10 █                          $7.6B   Procedure Mill
#11 ████                      $28.0B   MA Overpayment
#12 ██                        $13.0B   Consolidation Tax
#13 █                          $5.4B   Nonprofit Lie
#14 ████                      $27.6B   Specialist Tax
#15 ▏                          $2.55B  Facility Fee Scam
#16 ██                        $16.4B   The Other 100 Drugs (this issue)
   ──────────────────────────────────────────────────
   Total: $535.71B  ·  $2,704.29B remaining
   Scale: $3.24T (CMS NHE 2024; Japan OECD 2023)
Issue #2: The Same Pill, A Different Price found nine flagship Medicare Part D brand drugs priced at 7 to 581 times the equivalent United Kingdom price. Those nine drugs (Eliquis, Jardiance, Xarelto, Farxiga, Januvia, Entresto, Stelara, Imbruvica, Enbrel) accounted for $52.7 billion in 2023 Medicare gross spending and produced a booked $25 billion per year in recoverable savings.
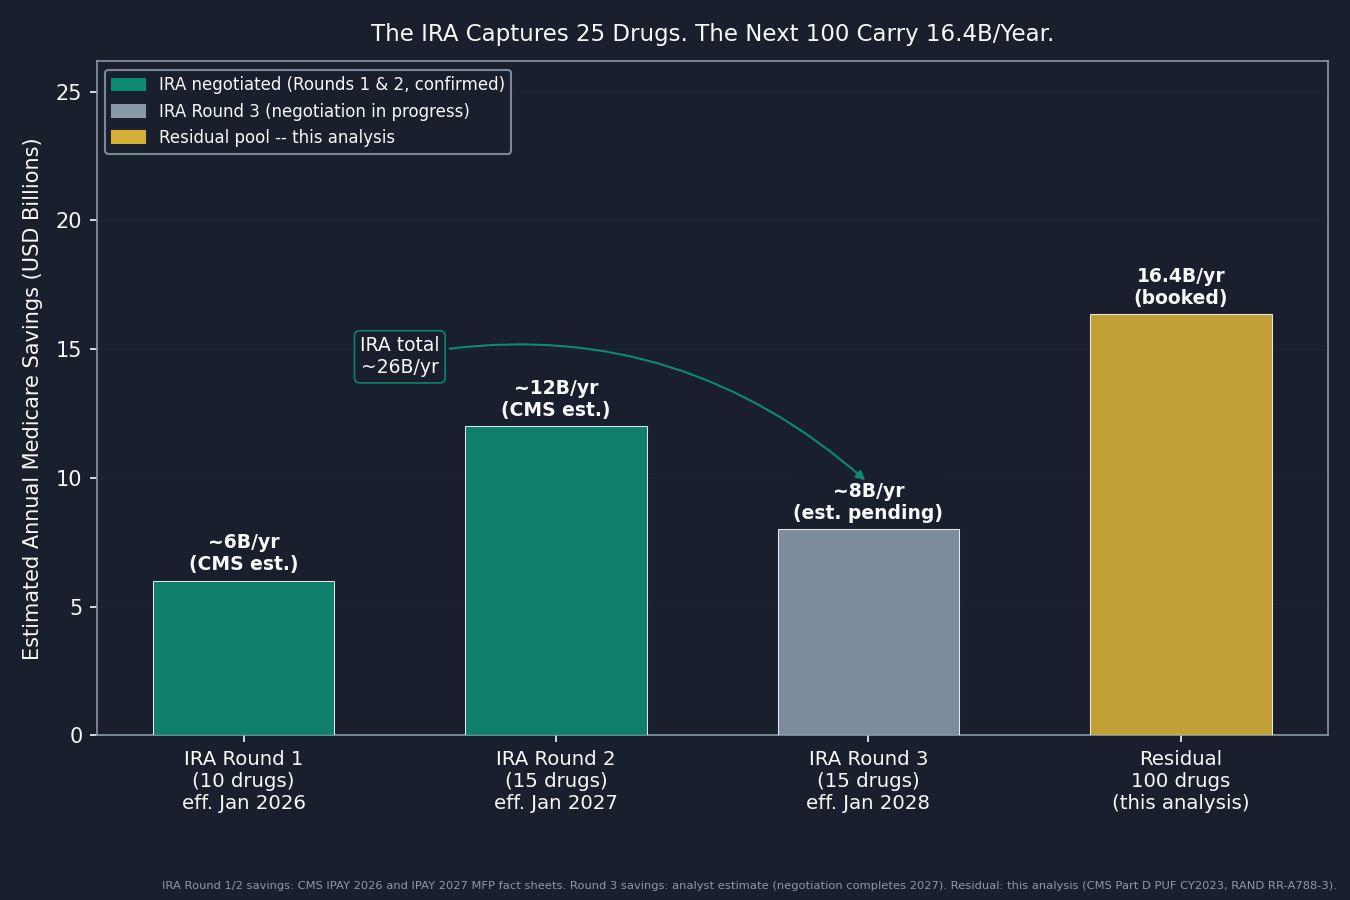
Then the Inflation Reduction Act (IRA) kicked in. Round 1 negotiations covered those nine plus one more drug; Round 2 added 15 drugs whose new prices take effect January 2027; Round 3 adds 10 more Part D drugs effective 2028. Twenty-five drugs total are now on a negotiated Maximum Fair Price (MFP) schedule.
The Centers for Medicare and Medicaid Services (CMS) Part D Spending by Drug Public Use File (PUF) lists thousands of drugs. The top 100 by gross spend account for roughly 60 percent of total Part D spending. Subtract everything already on an IRA list and what remains is 100 brand products (about 85 molecules) that haven't been touched. This analysis applies the same international reference framework from Issue #2 to those products, computes the per-molecule price gap on a net-to-net basis, and books the recoverable share.
The result: $16.4 billion per year (range $13.4B to $28.3B). After accounting for the manufacturer rebates Medicare already receives, US net prices for these brands still run roughly 3.2 times international net prices. The tools to address it already exist in statute.
The Universe
What the IRA Left Behind
The IRA negotiation framework is the most significant Medicare drug-pricing change in two decades. But it is a selection process, not a price ceiling. Each year, CMS negotiates the top 15 to 20 drugs by gross spending from an eligible pool. The drugs it selects get a negotiated MFP. Everything else continues at the manufacturer's list price, minus whatever rebate the pharmacy benefit manager (PBM) extracts.
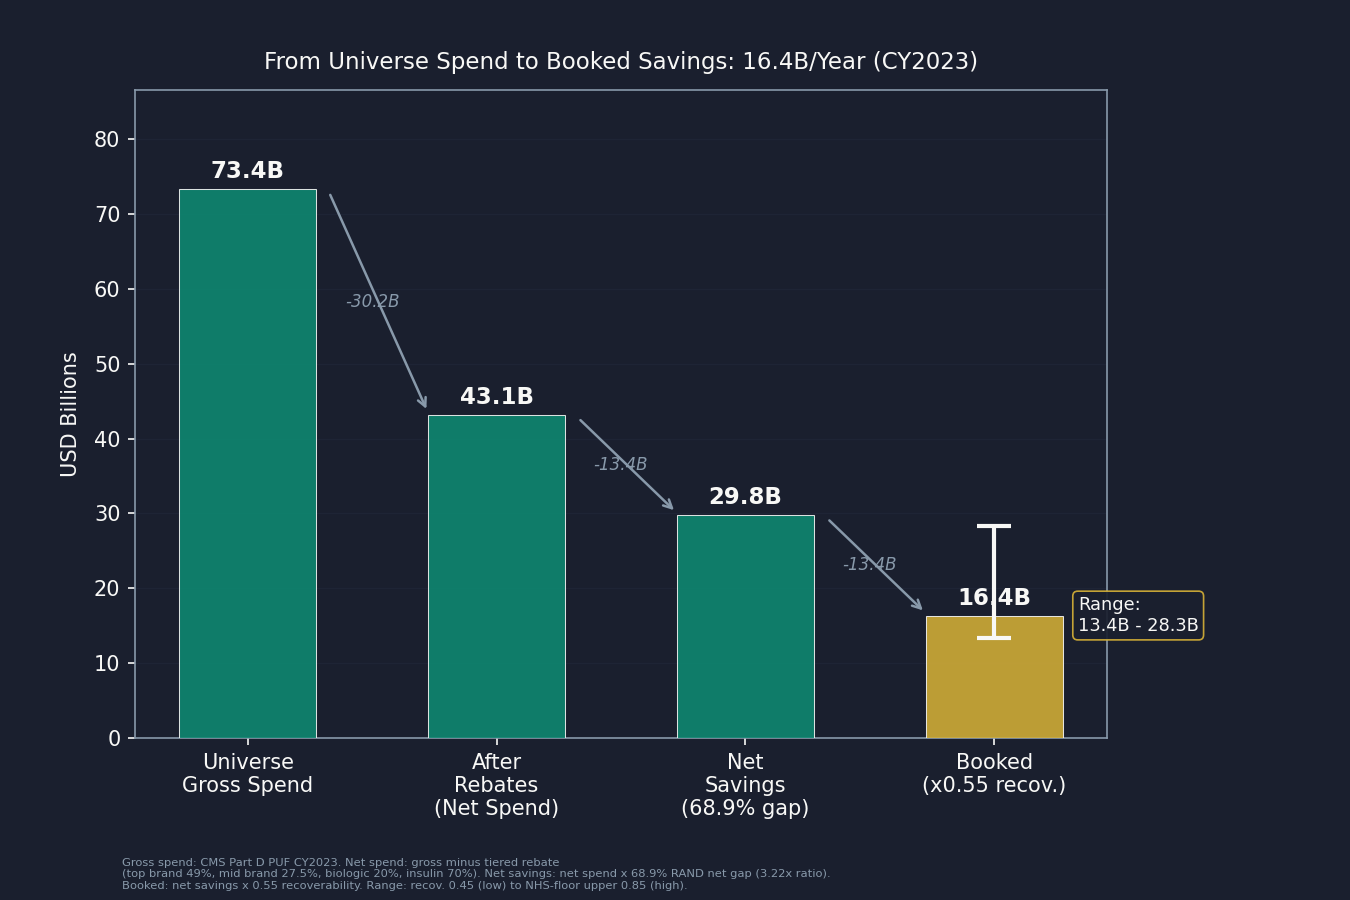
After removing all three IRA rounds and the nine drugs from Issue #2, the 100 highest-gross single-source brand products in the CY2023 Part D data represent $73.4 billion in annual Medicare spending (net spend base after rebates: approximately $43.1 billion). They span a wide range of therapeutic areas: autoimmune (Humira adalimumab formulations, Skyrizi, Rinvoq, Dupixent), oncology (Revlimid, Jakafi, Tagrisso, Lynparza, Brukinsa), cardiovascular (Brilinta, Repatha), respiratory (Spiriva, Breztri), diabetes (Lantus, Humalog, and other insulins), HIV antivirals (Genvoya, Descovy, and related products), neurology (Ingrezza, Nuplazid, Aubagio), and more.
Some context on what this universe is not. It excludes the GLP-1 drugs: Ozempic, Rybelsus, and Wegovy were captured in IRA Round 2, and tirzepatide (Mounjaro) is excluded here because Issue #7: The GLP-1 Gold Rush already booked that molecule's pricing gap. Vaccines are also excluded: Arexvy, Shingrix, and Abrysvo prices are set through national tender programs rather than the therapeutic-brand market, making the brand-drug reference ratio a poor fit. And all multi-source generics that leaked the brand filter were removed. The RAND data shows that US generic prices are actually at or below international levels, so applying a brand ratio to them would be a defect, not a finding.
How the Gap Is Measured
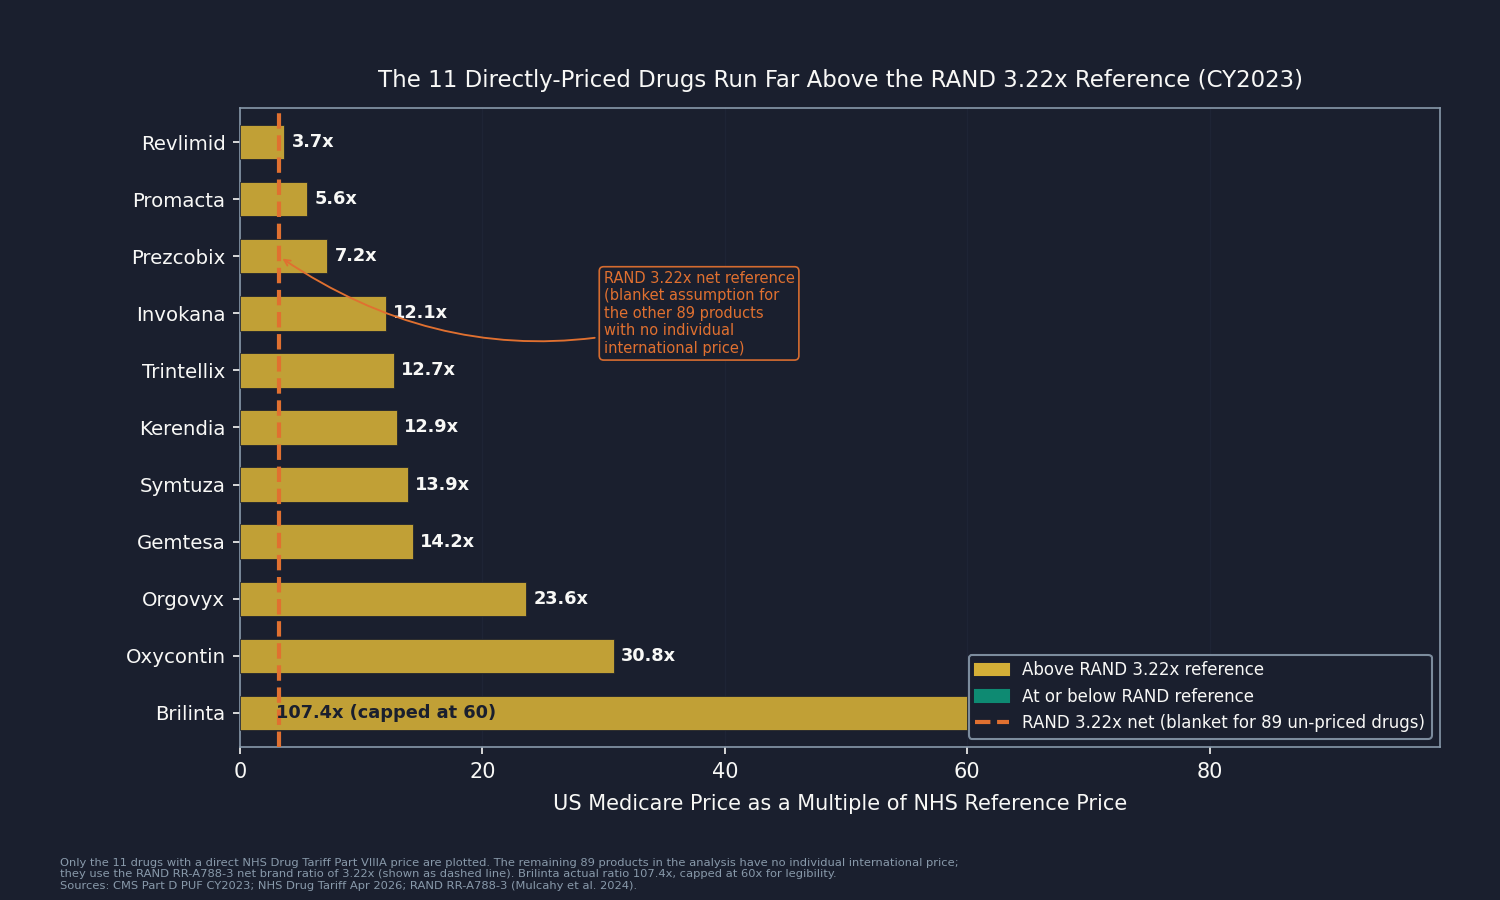
For 11 of the 100 products, there is a direct UK reference: the National Health Service (NHS) Drug Tariff Part VIIIA lists a reimbursement rate for the same molecule. The median gap on those 11 products is 12.9 times the US Medicare price. Ticagrelor (Brilinta) is 107 times more expensive in the US than the UK generic rate.
For the other 89 products (mostly on-patent biologics and newer brands without a UK generic equivalent), direct international pricing is not publicly available at the molecule level. The analysis uses RAND Research Report RR-A788-3 (Mulcahy, Schwam, Lovejoy, February 2024, "International Prescription Drug Price Comparisons"), which measures US brand-name originator drug prices against Organisation for Economic Co-operation and Development (OECD) comparison countries. The key figure for this analysis: after accounting for rebates, US net brand prices run about 3.22 times OECD peer country net prices.
That single blanket reference, applied to 89 products at once, is the most consequential assumption in the analysis. It cuts both ways, and the objections section below takes it on directly.
The Math: $16.4 Billion per Year
First, a word on rebates, because they drive the whole calculation. The list price of a brand drug is rarely what anyone actually pays. To win a spot on an insurance plan's covered drug list, the manufacturer agrees to pay money back after each sale, a rebate, to the pharmacy benefit manager that runs the plan's drug coverage. Those rebates are negotiated behind closed doors and are not public, but they are large: commonly 25 to 50 percent off the list price for a brand drug, and well above 70 percent in fiercely competed categories like insulin. The catch is that the government's spending data records the list price, before the rebate flows back, so it overstates what Medicare and its plans actually keep. Since the question here is what the system really pays, each drug's reported spending is marked down by a rebate estimate for its category before any international comparison is made.
The computation starts with the CMS Part D PUF for CY2023. For each of the 100 brand products:
- Net spend base: the published CMS figure is gross (list-price) spending, so a category rebate is subtracted to reach net. The rates: 49 percent for the 16 top-brand drugs, 27.5 percent for mid-spend brands, 20 percent for biologics, and 70 percent for insulin. Insulin carries by far the largest rebate. Lantus, Humalog, Levemir, and the other insulin products are discounted 65 to 84 percent off list (ASPE HP-2022-22; SSR Health net-price tracking), so subtracting 70 percent sharply lowers their contribution here. The PBM rebate layer on insulin was the subject of Issue #4: The Middlemen, and the savings computed here do not re-book it.
- Net savings: net spend multiplied by 68.9 percent, the gap implied by RAND's rebate-adjusted 3.22 times ratio (1 minus 1 divided by 3.22). Because the rebate has already come out of the spending base, it is not subtracted again here.
- Booked savings: net savings multiplied by a 0.55 recoverability factor, which discounts for the political and industry friction of extending Medicare price negotiation to drugs it has not selected.
Summed across all 100 brand products: $16.4 billion per year ($16.36B) at the central estimate.
The sensitivity band captures the main uncertainties:
- $13.4B (recoverability 0.45, the low end)
- $16.4B (recoverability 0.55, central net-to-net)
- $28.3B (upper: NHS-floor reference for the 11 matched molecules, recoverability 0.85)
A gross-price comparison, using RAND's 4.22 times list-price ratio instead of the net ratio, would put the figure at $18.1 billion; this analysis uses the lower net-to-net number. And when the same method is applied to Issue #2's nine drugs, it reproduces that issue's published $25 billion to within 0.2 percent.
The Top Drugs and Who Concentrates Them
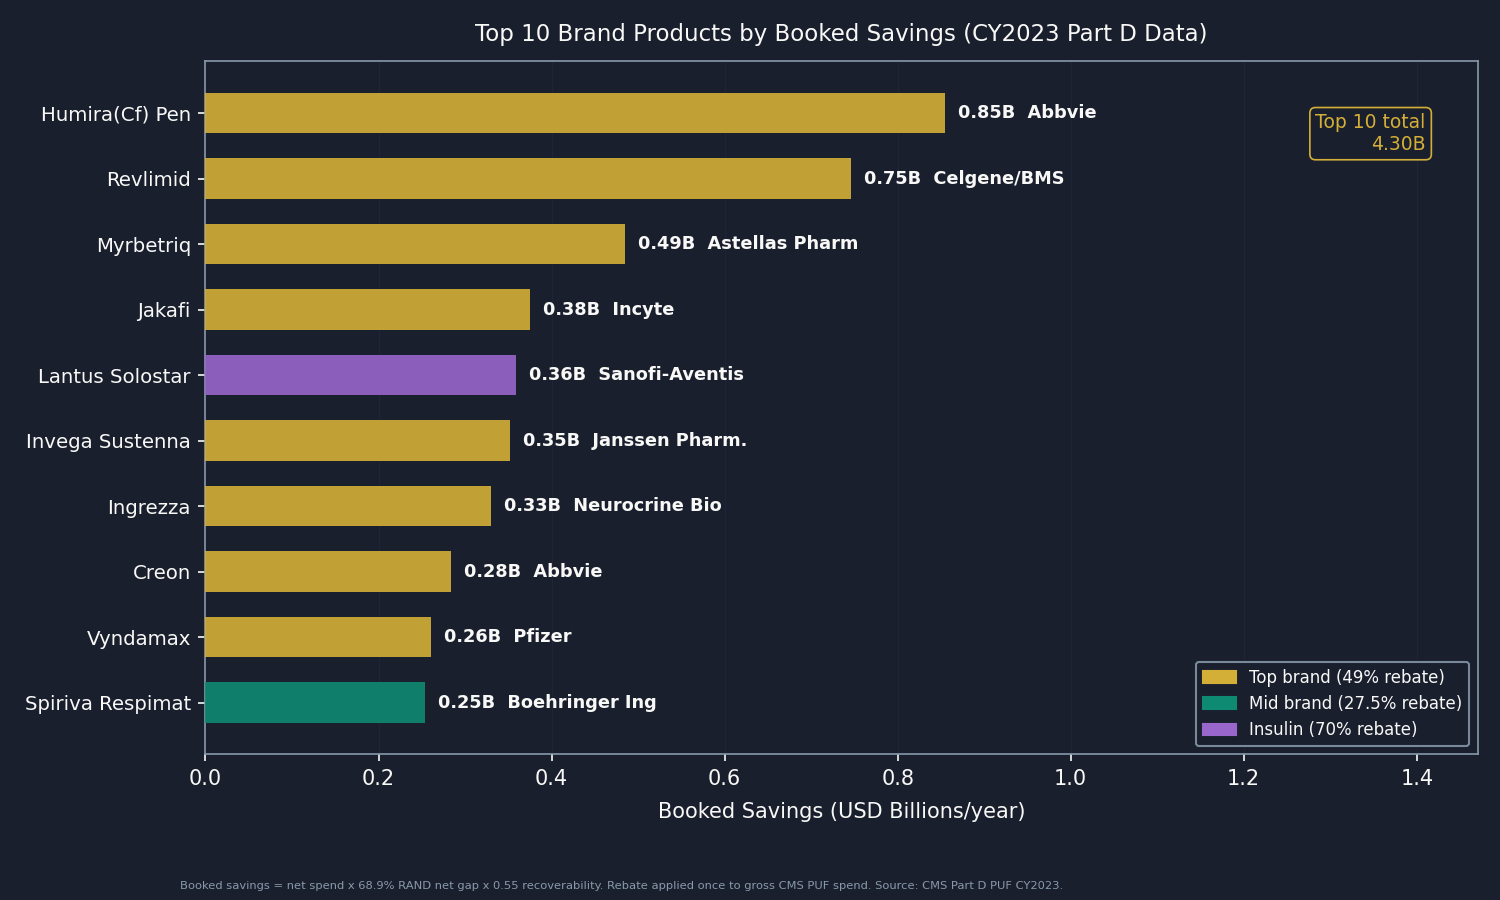
The 100-product panel is not evenly spread. By therapeutic class, mid-spend brands (54 products, $27.2B gross) produce $7.5B booked; top-spend brands (16 products, $27.8B gross) produce $5.4B; biologics (17 products, $7.5B gross) produce $2.3B; and insulin (13 products, $10.9B gross) produces $1.2B after its high rebate is applied. By manufacturer, three names carry the largest booked exposure: AbbVie (nine products, the single largest concentration), Sanofi (eight products, insulin-heavy), and AstraZeneca (five products). Each is profiled below.
Three Objections
"You applied one blanket ratio to 89 of 100 products. That is not a per-molecule price." Correct, and it is the most important limitation of the analysis. RAND RR-A788-3's OECD-33 brand net average is the best available public reference for drugs without direct international pricing. For the 11 products with a direct UK match, the median gap is 12.9 times, well above 3.22. That confirms the blanket reference is conservative for the molecules that can be priced directly. At the same time, the residual pool skews toward on-patent biologics and specialty drugs whose true gap may sit below the all-brand average, which pushes the other way. Both uncertainties are named; both point toward the value of per-drug international data (through IQVIA, Australia's Pharmaceutical Benefits Scheme (PBS), or Health Canada's Patented Medicine Prices Review Board (PMPRB)).
"Net prices are far lower than the gross figures in the PUF. You are inflating the savings." The booked $16.4 billion uses net Medicare spending as its base (gross PUF spend minus the documented tiered rebate, applied once), and RAND's rebate-adjusted net ratio as the price gap. The question is not whether rebates exist. It is whether the post-rebate US price is reasonable. At 3.22 times the OECD net average, it is not.
"US prices fund global pharmaceutical R&D. Cutting them will slow innovation." The empirical literature on R&D elasticity (Acemoglu/Linn 2004, Sood et al. 2009, Dubois et al. 2015) finds smaller effects than the industry counter implies. Switzerland, the UK, Germany, and Japan are all substantial pharmaceutical R&D hubs at prices well below US levels. And the $16.4 billion booked here is the recoverable share of a residual pool: even capturing all of it would leave US per-capita drug spending well above every peer country, preserving the revenue base that funds development.
Who Profits
The three manufacturers with the largest booked savings exposure in this analysis each hold portfolios in the non-IRA Part D residual that are unlikely to shrink absent direct policy intervention. Financial data from SEC and LSE filings.
AbbVie (ABBV) FY2024 Revenue: $56.3B | Operating Margin: ~20% | CEO Comp (Robert Michael, first year as CEO eff. July 2024): $18.5M | Stock Buybacks (2020-24): ~$3B | Lobbying (2020-24): ~$97M This issue's mechanism: AbbVie holds nine products in the 100-product panel: Humira and its biosimilar-era adalimumab formulations (Humira(Cf) Pen, Humira Pen, Humira(Cf)), plus Skyrizi, Rinvoq, Venclexta, Creon, and Synthroid. Their combined 2023 Part D gross is approximately $10.8 billion, producing $2.35 billion in booked savings. The mechanism is the same as in Issue #2: The Same Pill, A Different Price: no IRA MFP applies to any of these products, so AbbVie continues to price to the US market without an international reference ceiling. Humira's US biosimilar-era price remains multiples of the adalimumab reimbursement rate in Germany, France, and the UK, where biosimilar uptake drove down the reference price.
Sources: AbbVie FY2024 Form 10-K and DEF 14A proxy via SEC EDGAR; OpenSecrets.org federal lobbying disclosure database (2020-2024).
Sanofi (SNY) FY2024 Revenue: €41.1B (~$44.6B at 2024 avg EUR/USD 1.085) | Operating Margin: ~21% | CEO Comp (Paul Hudson): €10.3M (~$11.2M) | Lobbying (2020-24): ~$45M This issue's mechanism: Sanofi has eight products in the panel: the largest insulin cluster in the universe (Lantus Solostar, Lantus, Toujeo Solostar, Toujeo Max Solostar, and Soliqua) plus Dupixent Pen, Dupixent Syringe, and Aubagio. Total 2023 Part D gross is approximately $7.3 billion. The insulin lines carry a 70 percent rebate (the documented gross-to-net for insulin glargine products), so Sanofi's booked savings after rebate are $1.09 billion. The insulin rebate mechanism was covered in Issue #4: The Middlemen; the savings here represent the international reference gap not already captured by that rebate layer.
Sources: Sanofi FY2024 Universal Registration Document and Compensation Report via the Autorité des marchés financiers (amf-france.org); SEC 20-F filing via EDGAR; OpenSecrets.org federal lobbying disclosure database (2020-2024).
AstraZeneca (AZN) FY2024 Revenue: $54.1B | Operating Margin: 18.5% (reported; 33% core) | CEO Comp (Pascal Soriot): £16.6M FY2024 (about $21M) | Lobbying (2020-24): ~$55M This issue's mechanism: AstraZeneca has five products in the panel: Tagrisso (osimertinib), Breztri Aerosphere, Brilinta (ticagrelor), Lynparza (olaparib), and Bydureon Bcise. Symbicort was removed because generic budesonide/formoterol had launched by CY2023, and Calquence was captured in IRA Round 2. The five remaining products total approximately $3.5 billion in gross Part D spend and $0.87 billion in booked savings. Brilinta illustrates the mechanism directly: ticagrelor's US Medicare per-unit price is 107 times the NHS generic reimbursement rate for the same molecule (NHS Drug Tariff Part VIIIA April 2026).
Sources: AstraZeneca FY2024 Annual Report and Directors' Remuneration Report (astrazeneca.com/investor-relations); LSE filing for AZN; OpenSecrets.org federal lobbying disclosure database (2020-2024).
The Fix
The IRA negotiation framework is statutory and has survived legal challenges from pharmaceutical manufacturers. It operates as a selection process: CMS announces each year's candidate pool and negotiates prices for the top drugs by spend. Two variables determine how much of the $16.4 billion residual is captured: how many drugs per cycle and over what timeframe.
Immediate (CMS administrative): The IRA as written allows CMS to increase the number of drugs negotiated per cycle as the program matures: 15 per year through 2028, increasing to 20 in 2029 onward. CMS has no statutory authority to accelerate beyond that schedule, but it can optimize within it by selecting from the high-savings-per-drug candidates in this analysis. The top 10 products in the panel account for roughly $4.3 billion in booked savings. Several of them (Humira(Cf) Pen, Revlimid, Myrbetriq, Jakafi) would likely appear in the Round 4 or Round 5 candidate pool under current CMS selection criteria. No new legislation is required to capture this subset.
Medium-term (Congress): Congress could expand the annual negotiation cap beyond 20 drugs per cycle, either through a standalone bill or as a provision attached to broader healthcare legislation. Expanding from 20 to 30 or 50 drugs per cycle would materially accelerate coverage of the residual pool. The IRA's precedent makes this an extension of an existing legal framework, not a new policy design. The binding constraint is political, not administrative.
Alternative path (international reference pricing for the residual): A separate policy option is a flat reference-price ceiling for Part D drugs not selected for IRA negotiation: for example, capping the Part D reimbursement rate at the OECD average for brand drugs outside the negotiation list. This is a different mechanism from negotiation, with different legal and political risk profiles. The April 2026 Most Favored Nation pharmaceutical tariff executive order moved in this direction via trade policy rather than the Medicare framework; that approach is in litigation. The IRA negotiation path is the lower-risk route.
Who can act: CMS through annual drug-selection decisions and negotiation protocols (no legislation required for the existing pace). Congress to expand the per-cycle cap. The pharmaceutical industry has sued to challenge the IRA framework and lost; the legal path is established.
What's Next
Issue #17: The Part B Pharmacy Premium. Issues #2 and #16 covered Medicare Part D, the program that pays for oral and self-administered drugs dispensed at retail pharmacy. Issue #17 turns to Medicare Part B, which pays for physician-administered drugs: oncology biologics, infused therapies, and drugs given in a physician office or hospital outpatient department. The Part B drug universe is structurally different. Prices are set via the Average Sales Price (ASP) plus a 6 percent markup formula rather than via PBM-negotiated rebates, and the largest single drug in Medicare by gross spend, Keytruda (pembrolizumab), is in this program. The IRA Round 3 announcement (January 27, 2026) selected the first Part B drugs for negotiation, effective 2028. Issue #17 quantifies the residual non-IRA Part B universe.
If you have access to per-molecule international pricing data beyond the NHS Drug Tariff or RAND's published ratios, particularly from Australia's Pharmaceutical Benefits Scheme (PBS), Health Canada's Patented Medicine Prices Review Board (PMPRB), or Germany's GKV-Spitzenverband negotiated rates, these are exactly the inputs that would replace the population-average 3.22x reference with per-drug comparisons for the 89 molecules currently using the RAND average. That substitution would either confirm the central estimate or sharpen it in either direction. Reach out at contact@ahcdata.fund or ahcdata.fund.
Worked inside the system? We talk with people who have seen pharmaceutical pricing, PBM contract negotiation, Medicare Part D formulary design, or IRA negotiation processes from the inside. If you can help us understand how these processes actually work, or point us to documentation that does, we would value a conversation, on background and in confidence. Reach us at contact@ahcdata.fund.
All analysis code is at github.com/rexrodeo/american-healthcare-conundrum. If the math looks wrong, say so.
If this issue was useful, forward it to someone who pays for a prescription drug, which is most people.
Sources: CMS Medicare Part D Spending by Drug PUF CY2023 annual release (data.cms.gov); RAND RR-A788-3, Mulcahy/Schwam/Lovejoy, "International Prescription Drug Price Comparisons: Estimates Using 2022 Data," Feb 2024 (DOI 10.7249/RRA788-3); NHS Drug Tariff Part VIIIA April 2026 (nhsbsa.nhs.uk); CMS IPAY 2026 MFP fact sheet (cms.gov); CMS IPAY 2027 selected-drug list and MFP fact sheet, Nov 25, 2025 (cms.gov); CMS IPAY 2028 selected-drug list, Jan 27, 2026 (cms.gov); ASPE HP-2022-22, "Insulin Affordability and the Inflation Reduction Act" (aspe.hhs.gov); SSR Health manufacturer net-price tracking for insulin glargine/lispro/aspart; Medicare Trustees Report 2024, Table IV.B10 (cms.gov); Acemoglu/Linn 2004 (Quarterly Journal of Economics 119(3):1049-1090, DOI 10.1162/0033553041502144); Sood/Shih/Yu/Goldman 2009 RAND WR-642; Dubois et al. 2015 (RAND Journal of Economics 46(4):844-871, DOI 10.1111/1756-2171.12113); Peterson-KFF Health System Tracker international drug price comparisons (healthsystemtracker.org); AbbVie FY2024 10-K and DEF 14A proxy via SEC EDGAR; AstraZeneca FY2024 Annual Report via LSE/astrazeneca.com; Sanofi FY2024 Universal Registration Document via amf-france.org and SEC 20-F via EDGAR; OpenSecrets.org federal lobbying disclosure database (2020-2024).
Correction (July 2026): In the R&D-elasticity note, the Acemoglu and Linn 2004 citation is corrected to Quarterly Journal of Economics, and a citation that could not be verified against a real published source is replaced with Dubois et al. 2015 (RAND Journal of Economics). The point stands on the remaining sources and is not a booked-savings input.
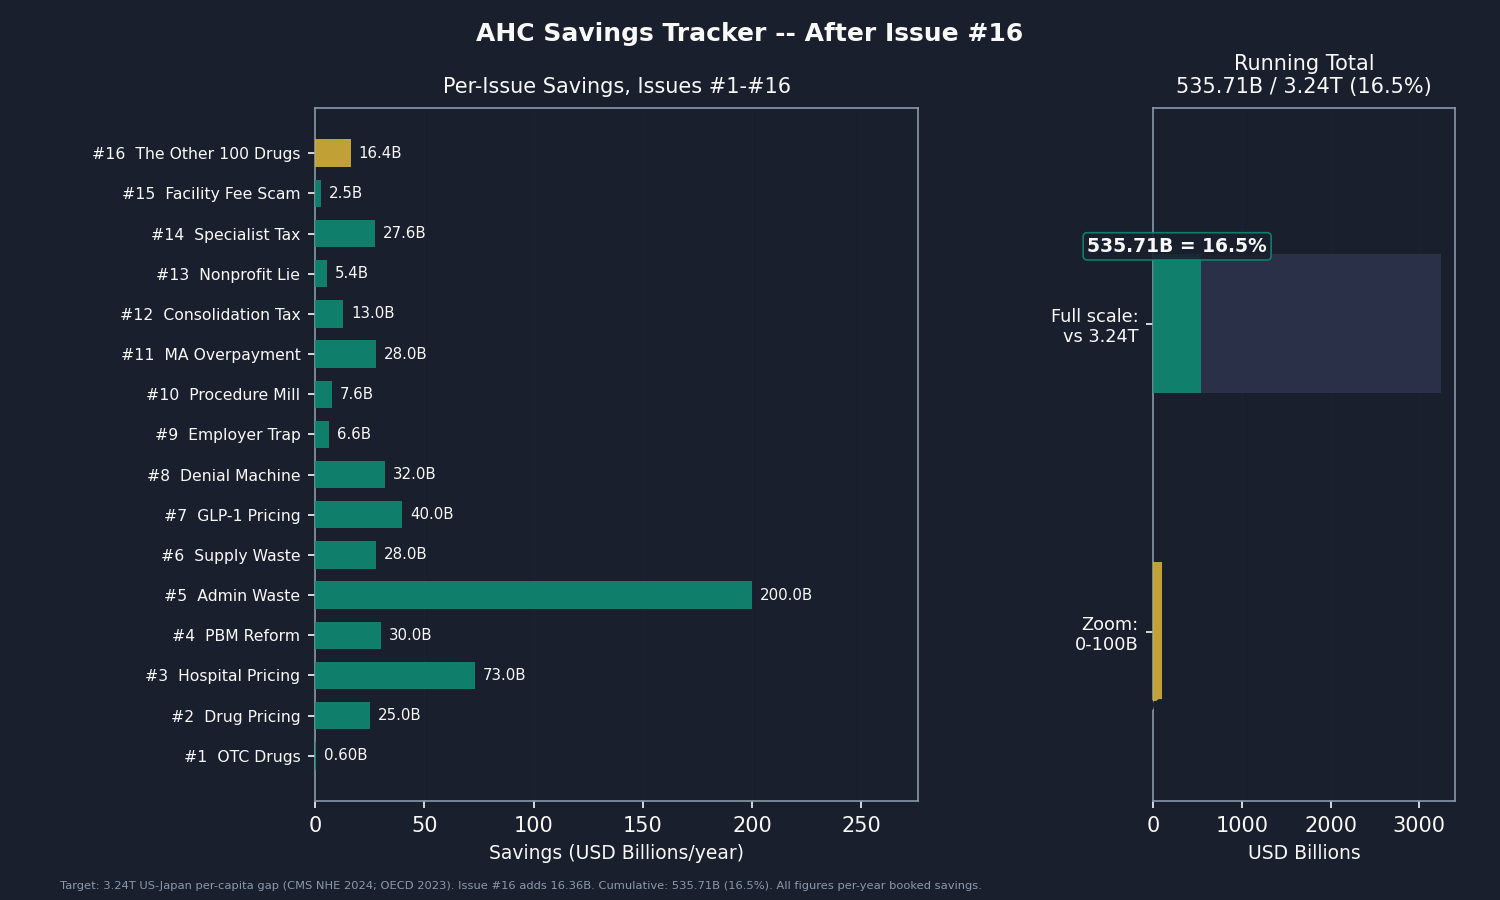
Running total after Issue #16: $535.71B / $3.24T (16.5%)
Methodology footnotes: Universe: top 100 single-source brand products (~85 molecules) in the CMS Part D PUF CY2023, after removing IRA Round 1 (11 keys), Round 2 (17 keys), and Round 3 (15 keys) selections; tirzepatide (Mounjaro/Zepbound) excluded on Issue #7 GLP-1 overlap basis (ROADMAP rule #5); multi-source generic leakers (Levothyroxine Sodium, Pantoprazole Sodium, Potassium Chloride, Diclofenac Sodium, Hydrocodone-Acetaminophen, Albuterol Sulfate HFA-Prasco, Fluticasone-Salmeterol-Prasco) removed; curated multi-source-brand leaks with available generics by CY2023 removed (Symbicort, Restasis, Advair Diskus/HFA, Vascepa, Flovent HFA, Copaxone, Latuda, Multaq); RSV/shingles vaccines (Arexvy, Shingrix, Abrysvo) excluded because RAND therapeutic-brand ratio is a poor fit for tender-procured vaccines; Synthroid (branded levothyroxine, Abbvie) kept as a genuine single-source brand; universe backfilled to 100 from rank 101+ after each exclusion. Universe gross spend: $73.4B; net spend base: $43.1B. Per-product computation (net-to-net central): net_spend = Tot_Spndng × (1 − rebate_fraction); net_savings = net_spend × 0.689 (RAND net gap, from 3.22x net ratio: 1 − 1/3.22); booked = net_savings × 0.55. Rebate applied once. Rebate fractions: top_brand 0.49, mid_brand 0.275, biologic 0.20, insulin 0.70 (ASPE HP-2022-22; SSR Health; Trustees Report). RAND 3.22x: brand-name originator rebate-adjusted net ratio from RAND RR-A788-3; confirmed as brand-only (not the all-drugs 2.78x). Upper-method sensitivity (not central): gross gap 0.763 (from 4.22x) on net base = $18.1B. NHS direct match: 11 products, median gap 12.9x (P25 9.6x, P75 18.9x, P90 30.8x, max 107x on ticagrelor). Recoverability: 0.55 central (range 0.45−0.85). NHS-floor upper (11 NHS-matched molecules at actual NHS gaps, recov 0.85): $28.3B. Cross-validation: Issue #2 nine-drug universe reproduced at −0.2% vs. published $25B. Overlap: Issue #2 nine drugs excluded by construction (all in IRA Round 1); Issue #4 PBM mechanism distinct from international reference pricing (insulin rebate tier nets out the PBM layer); Issue #7 GLP-1 excluded (tirzepatide removed, semaglutides in IRA Round 2); Issue #17 Part B is a separate Medicare program. Denominator: $3.24T US-Japan per-capita gap (CMS NHE 2024 final, OECD Health at a Glance 2025).
Cumulative after Issue #15: $519.35B. Issue #16 adds $16.36B. New cumulative: $535.71B.
The American Healthcare Conundrum publishes when the data is ready. All analysis uses publicly available data. Code is open-source. Figures are validated before publication.
Get every issue in your inbox
The American Healthcare Conundrum is free. One fixable problem in U.S. healthcare, with the data, every week.