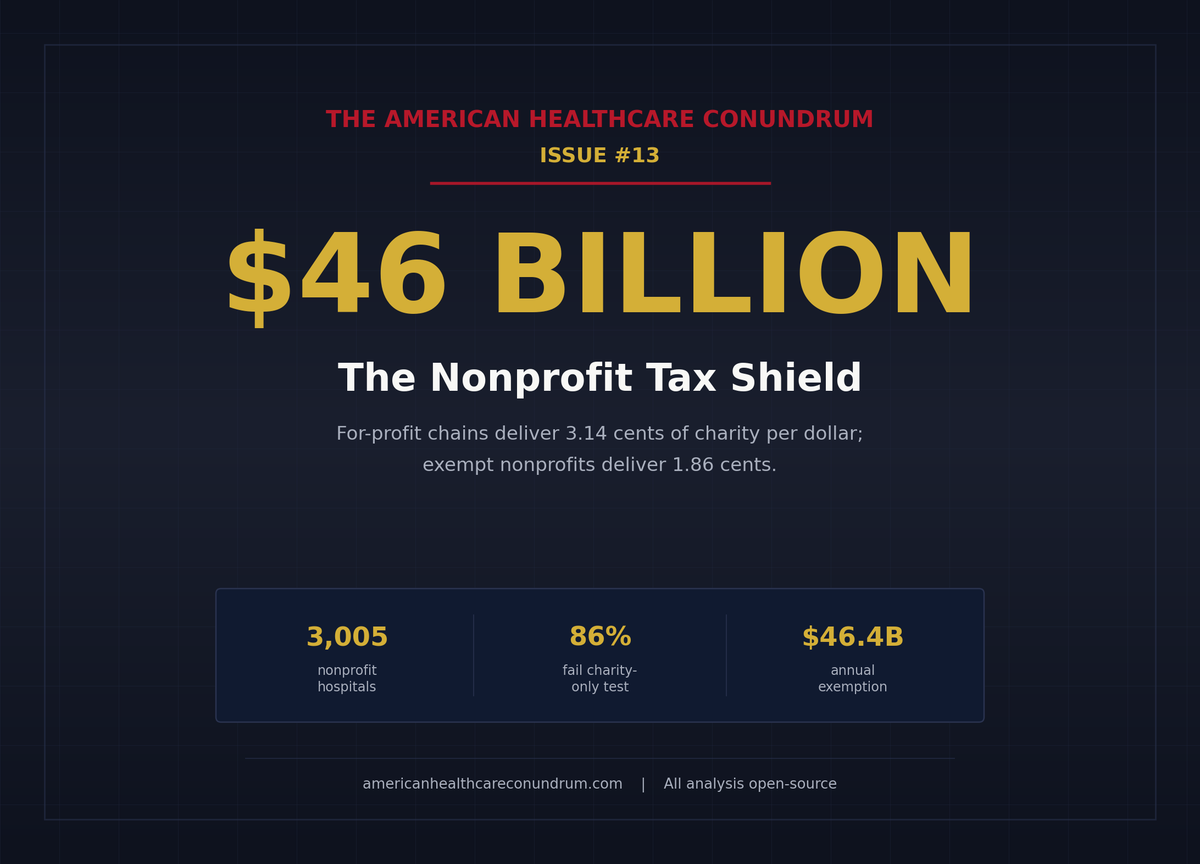
Issue #13: The Nonprofit Lie
How $46 billion in annual tax exemptions flows to nonprofit hospitals that deliver less charity care per dollar than the for-profit chains paying full taxes
Each issue of The American Healthcare Conundrum identifies one fixable problem in U.S. healthcare spending, builds the data case, and recommends a specific policy fix. All analysis uses publicly available data. Code is open-source.
Target: ~$3.24T US-Japan per-capita spending gap
(Japan: highest life expectancy, lowest infant
 mortality in OECD, ~half US per-capita spend)

Full scale: $0 ───────────────────────── $3.24T
            ████░░░░░░░░░░░░░░░░░░░░░░  15.1%
            ↑ $489.2B identified

Per-issue savings (1 block ≈ $8B; max bar = $200B):
 #1 ▏                          $0.6B   OTC Drug Overspending
 #2 ███                       $25.0B   Drug Pricing
 #3 █████████                 $73.0B   Hospital Pricing
 #4 ████                      $30.0B   PBM Reform
 #5 █████████████████████████ $200.0B  Admin Waste
 #6 ███                       $28.0B   Supply Waste
 #7 █████                     $40.0B   GLP-1 Pricing
 #8 ████                      $32.0B   Denial Machine
 #9 █                          $6.6B   Employer Trap
#10 █                          $7.6B   Procedure Mill
#11 ████                      $28.0B   MA Overpayment
#12 ██                        $13.0B   Consolidation Tax
#13 █                          $5.4B   Nonprofit Lie (this issue)
   ────────────────────────────────────────────────
   Total: $489.2B  ·  $2,750.8B remaining
   Scale: $3.24T (CMS NHE 2024; Japan OECD 2023)
Kaiser Foundation Hospitals filed one Form 990 covering 43 facilities for fiscal year 2023. On Schedule H, the community benefit schedule that tax-exempt hospitals file with the Internal Revenue Service (IRS), line 7k reports the total value of community benefit those 43 facilities provided: $1.32 billion.
That number sounds large, and Kaiser is a large system. Kaiser Permanente is the second-largest nonprofit hospital system in the United States by revenue, and it was built over decades on an integrated-care model that many health policy researchers genuinely admire. This is not a story about a bad actor.
It is a story about a structural problem that shows up in Kaiser's filing just as it shows up across 3,005 nonprofit hospitals we analyzed from public federal data.
Here is the structural problem, stated plainly: 86 percent of US nonprofit hospitals deliver less audited charity care than the dollar value of the tax exemptions they receive. Sixty-seven percent of US hospitals operate as nonprofit, tax-exempt entities under Section 501(c)(3) of the Internal Revenue Code. The tax code offers them a substantial shield in exchange for a community-benefit obligation. For most of them, the math on that exchange does not close.
The total value of the federal, state, and local tax exemption across our panel of 3,005 nonprofit hospitals is $46.4 billion per year. The audited charity care those hospitals deliver, measured from the Centers for Medicare and Medicaid Services (CMS) Healthcare Cost Report Information System (HCRIS), is $17.2 billion per year. The gap between those two numbers, hospital by hospital, is the question this issue answers.
The Tax Shield
A hospital that qualifies as a 501(c)(3) nonprofit does not pay federal income tax on its operating surplus. In most states it does not pay state income tax. In most jurisdictions it does not pay property tax on its land and buildings. In most states it does not pay sales tax on supplies and equipment. It can issue tax-exempt municipal bonds at interest rates several percentage points below what a taxable borrower would pay. And when individuals or corporations donate to it, those donors can deduct the gift from their own federal and state taxes.
These are not small benefits. Across our FY2023 panel of 3,005 nonprofit hospitals, the aggregate value of all those exemptions is $46.4 billion. The components, using the method published by Plummer, Socal, and Bai in the Journal of the American Medical Association (JAMA) in 2024, break down as follows:
- Federal income tax forgone: $17.0 billion (36.6%)
- Sales tax exemption: $11.4 billion (24.6%)
- Property tax exemption: $9.7 billion (20.9%)
- State income tax forgone: $4.8 billion (10.3%)
- Tax-exempt bond financing subsidy: $2.4 billion (5.2%)
- Charitable deduction pass-through to donors: $1.0 billion (2.2%)
- Federal Unemployment Tax Act (FUTA) exemption: $0.1 billion (0.2%)

The property tax piece, at $9.7 billion, is the one that lands hardest locally. When a nonprofit hospital's downtown campus does not pay property taxes, those taxes are either raised on other property owners or not collected at all. The gap is not abstract. It lands on the city's balance sheet.
What the Law Requires
The law that governs this exchange is Section 501(r) of the Affordable Care Act (ACA), which Congress codified in 2010. Section 501(r) does not specify a dollar floor for charity care. It does not require that the value of community benefit match the value of the tax exemption. What it requires is procedural: each tax-exempt hospital must conduct a Community Health Needs Assessment (CHNA) every three years, maintain a financial assistance policy, limit charges to financial-assistance-eligible patients, and restrict billing-and-collections practices against those patients.
The IRS enforces Section 501(r) through its Tax Exempt and Government Entities (TE/GE) division. Noncompliance with the CHNA requirement triggers an excise tax of $50,000. Serious or repeated noncompliance can result in revocation of tax-exempt status.
In the history of 501(r) enforcement, the IRS has revoked the tax-exempt status of exactly one hospital for Section 501(r) failure. One. The $50,000 CHNA excise tax is the only routine penalty in the framework. The 2025 TE/GE Program Letter named hospital tax-exempt examination as a strategic priority, but the results of that examination program are not yet public.
The upshot is that Section 501(r) enforces process, not outcomes. A hospital that conducts its CHNA, posts its financial assistance policy on the wall, and delivers $1 in charity care is in compliance. The law does not require the dollar value of charity care to bear any specific relationship to the dollar value of the tax exemption the hospital receives.
That is the enforcement gap. Everything that follows flows from it.
The Test, Two Ways
There are two ways to ask whether a hospital is delivering enough community benefit to justify its tax exemption, and they give different answers.
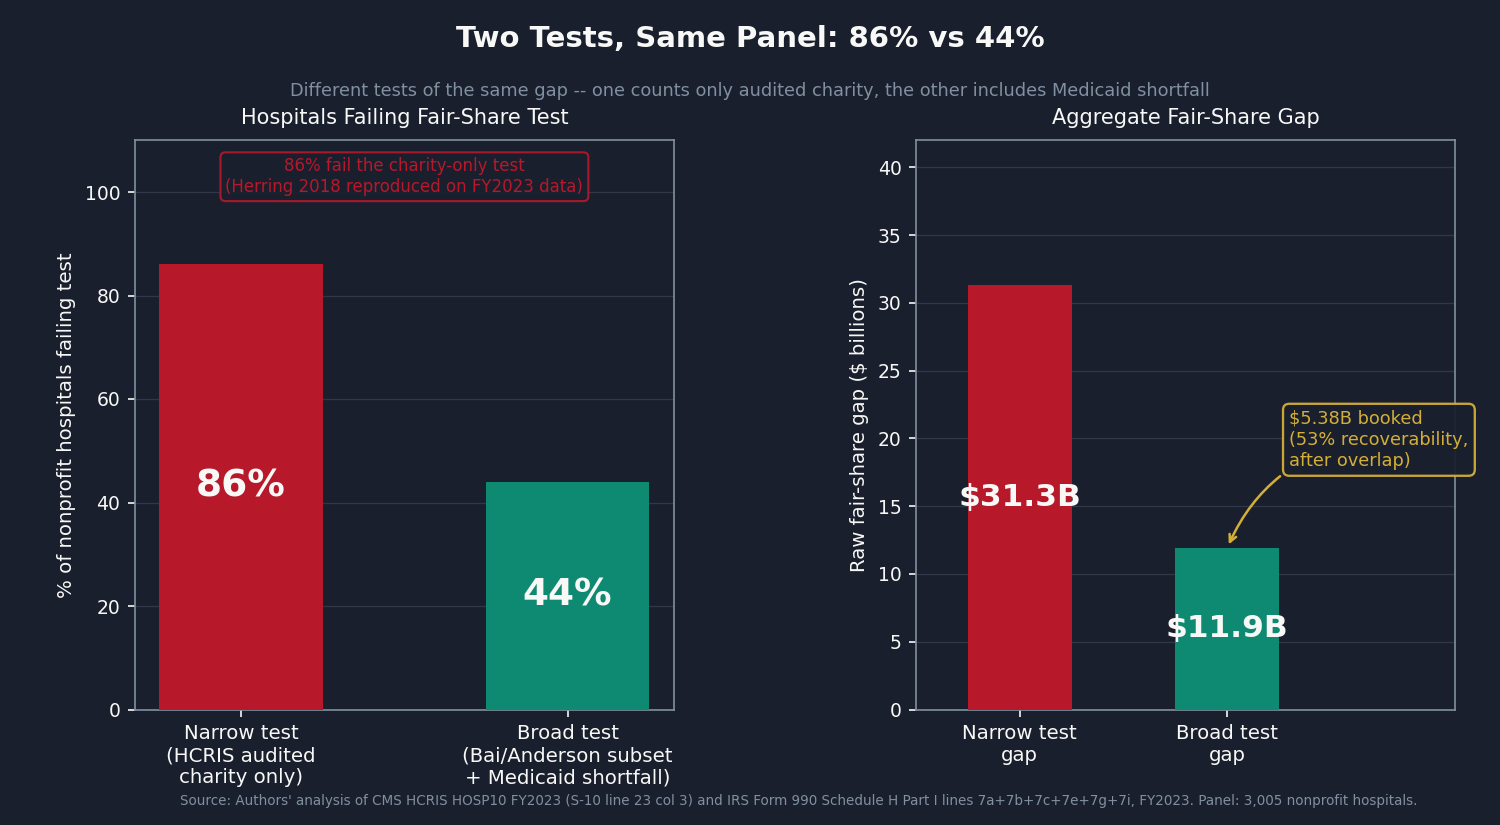
The narrow test asks only about charity care: the free or discounted care a hospital gives patients who cannot pay. It uses the audited figure CMS collects through cost reports, so the number cannot be massaged. If that audited charity care is less than the dollar value of the tax exemption, the hospital fails. This is the test Herring and colleagues published in 2018.
The broad test counts charity care plus several other things hospitals do for their communities: covering the gap between what Medicaid pays and what care costs, running community health programs, subsidizing money-losing services, donating to local nonprofits. This is the academic standard published by Bai and colleagues in 2021. It is more generous to hospitals than the narrow test, mostly because the Medicaid shortfall component is large.
Both tests matter. The narrow test sits on an audited number. The broad test captures more of what hospitals actually do but relies on self-reporting for the Medicaid piece. We ran both.
The Data: 3,005 Hospitals, FY2023
We computed a tax-exemption value and a community-benefit number for every nonprofit hospital that filed a complete FY2023 Medicare cost report (3,005 hospitals after removing partial-year filings and extreme outliers). For about half the panel we also pulled the hospital's Form 990 Schedule H community-benefit filing directly; for the rest we worked from the audited charity-care number CMS publishes. Methodology details are in the Sources block at the bottom.
The narrow test results:
Approximately 86 percent of the 3,005 nonprofit hospitals deliver less in audited HCRIS charity care than the value of their tax exemption. The aggregate gap across those failing hospitals is approximately $31.3 billion per year.
This 86 percent figure reproduces the Herring 2018 finding to within rounding on our FY2023 panel. That replication on seven years of intervening data is the validation that the per-hospital tax-exemption math is calibrated correctly.
The broad test results:
Approximately 44 percent of the 3,005 nonprofit hospitals deliver less in the Bai/Yehia/Chen/Anderson conservative Schedule H subset than the value of their tax exemption. The aggregate gap across those failing hospitals is $11.9 billion per year.
The broad test is more permissive because Medicaid shortfall is large: $44.1 billion in aggregate across matched filers, the single largest component of the Schedule H broad subset. For many hospitals, particularly those that take on substantial Medicaid patient volume, the Medicaid shortfall alone pushes their broad-subset community benefit above the tax-exemption value. Those hospitals do not contribute to the broad-test gap, and they should not.
The ownership comparison:
The most important number in this issue is not the aggregate gap. It is the per-dollar comparison by ownership type.
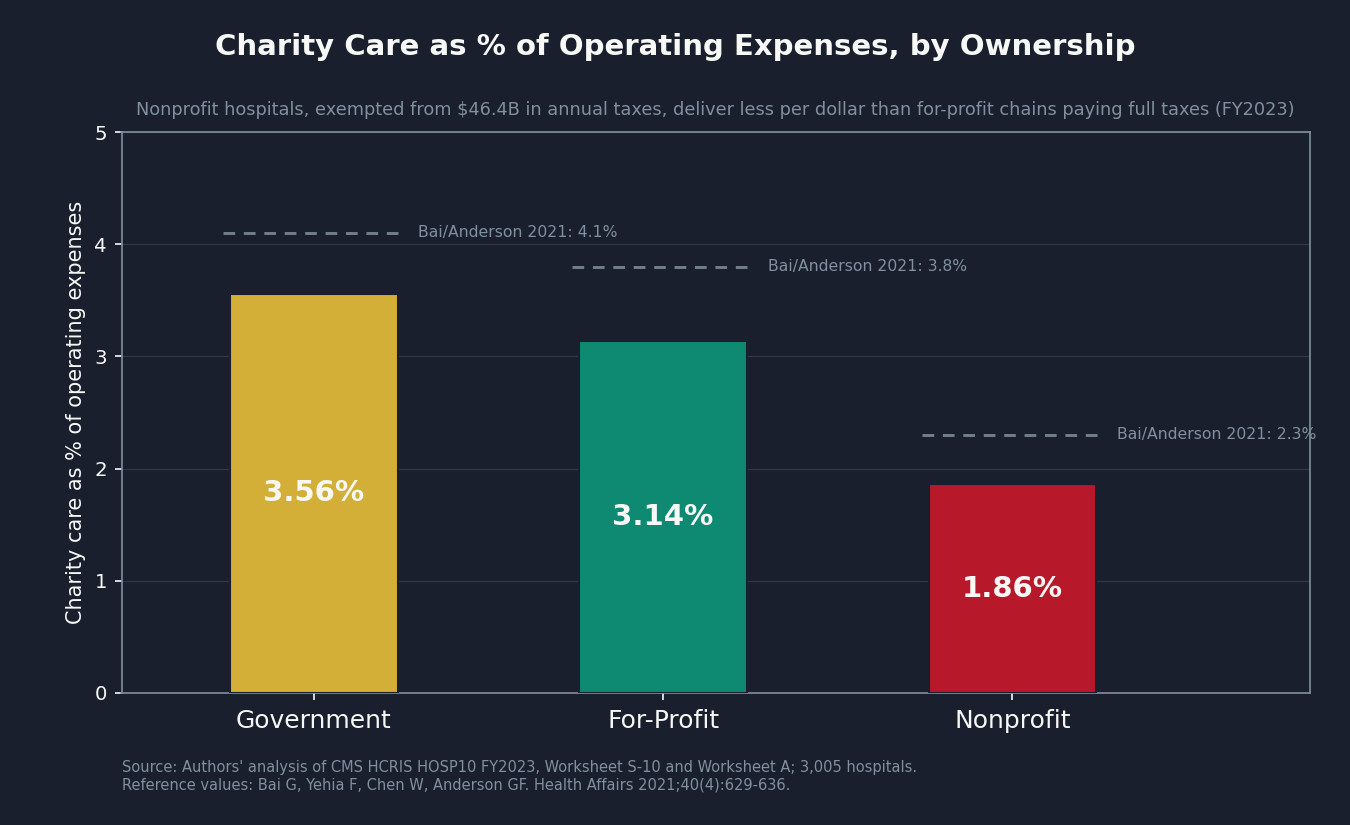
Government hospitals (county hospitals, city hospitals, state university medical centers) deliver charity care equal to 3.56% of their operating expenses. For-profit hospitals deliver charity care equal to 3.14% of their operating expenses. Nonprofit hospitals deliver charity care equal to 1.86% of their operating expenses.
Government hospitals are not tax-exempt in the same sense: they pay neither federal nor state income tax, but they are not organized under 501(c)(3) and do not receive the same tax benefits. For-profit hospitals, like HCA Healthcare, pay full federal income tax, state income tax, property taxes, and sales taxes. They receive no bond interest subsidy. Their charitable-deduction pass-through is not available to donors in the same way.
The for-profit hospitals in this panel, paying full taxes, deliver 3.14 cents of charity per dollar of expenses. The nonprofit hospitals, exempted from that tax load worth $46.4 billion annually, deliver 1.86 cents. This ordering, first documented by Bai and colleagues in 2021 on an earlier panel, holds in our FY2023 data.
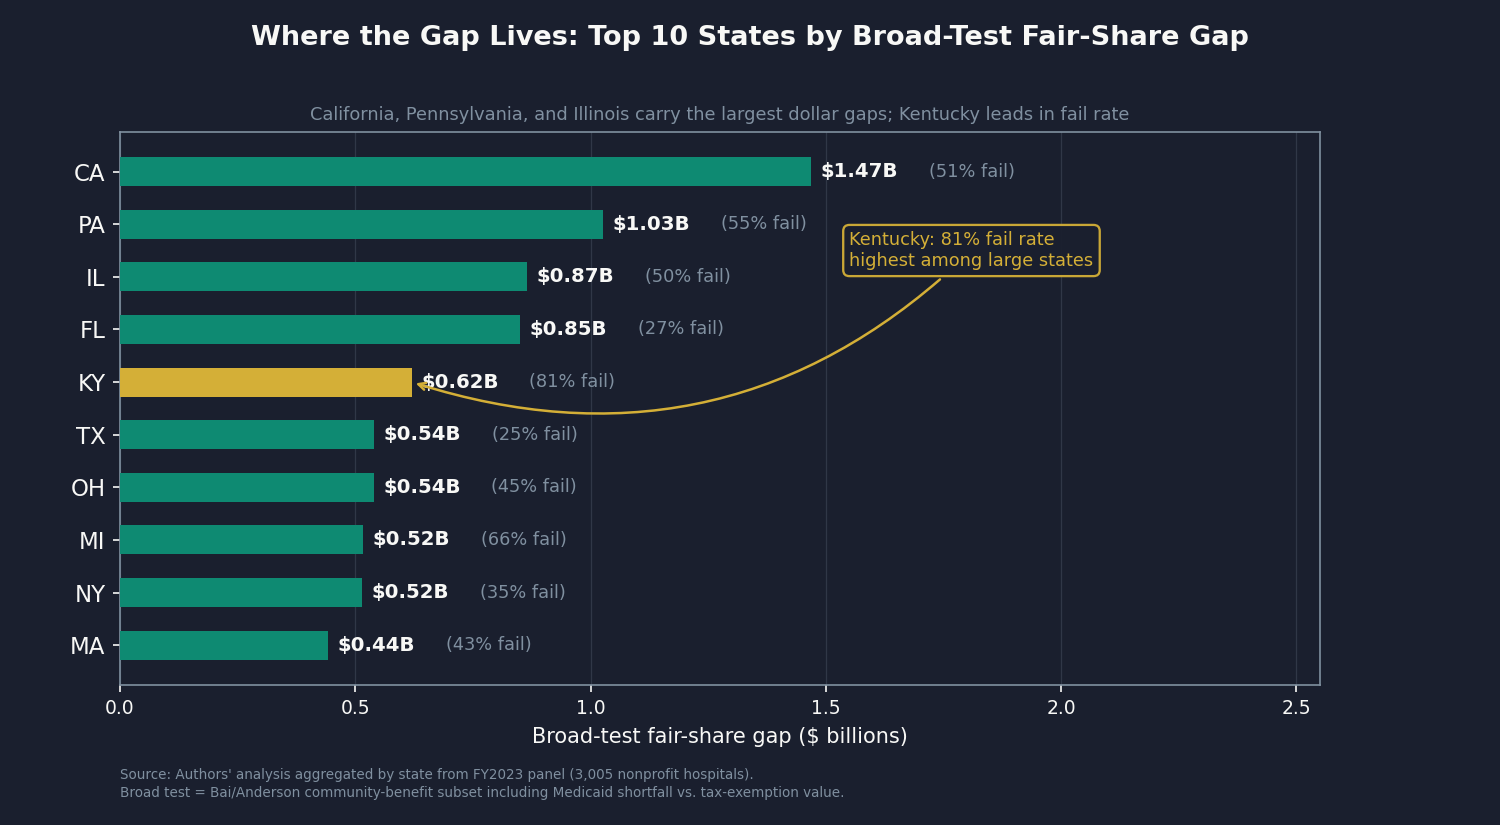
State concentration:
The gap is not evenly distributed. California accounts for $1.47 billion of the broad-test gap, the largest single state. Pennsylvania contributes $1.03 billion. Illinois ($0.87 billion), Florida ($0.85 billion), Kentucky ($0.62 billion), Texas ($0.54 billion), Ohio ($0.54 billion), Michigan ($0.52 billion), New York ($0.52 billion), and Massachusetts ($0.44 billion) round out the top ten. Kentucky's 81 percent fail rate on the broad test is the highest among large states.
Concentration:
The tax shield is heavily concentrated. The largest 7 percent of nonprofit hospitals capture roughly 46 percent of the total $46.4 billion. The biggest systems (Kaiser, CommonSpirit, Cleveland Clinic, Ascension) each file a single Form 990 covering dozens of hospitals, which is why an enforcement framework that targets large systems is structurally different from one that has to police thousands of community hospitals one at a time.
What We Can and Cannot Say
There are two real pushbacks on this analysis. Here is how we handle each.
Pushback 1: the AHA says it's 10-to-1.
The American Hospital Association (AHA) commissioned a 2024 EY study that put nonprofit hospital community benefit at 10 times their tax exemption. That ratio is mathematically correct. It also compares two different things.
The AHA number counts only the federal piece of the tax shield (about $13 billion), while ours counts federal plus state plus local (about $46 billion). On the other side, the AHA counts everything hospitals report on Schedule H, including research budgets, medical-resident training, and unpaid bills. The academic literature strips those out and counts only direct patient-targeted spending. Apples and oranges, with different sized buckets on each side.
On a like-for-like comparison applied to our 2023 panel, the ratio is 1.5-to-1 at the sector average. And that average hides what actually matters: hospital-by-hospital, 44 percent of nonprofits fall below their own exemption value on the broad test, and 86 percent fall below it on the audited-charity-only test.
Pushback 2: nonprofit hospitals serve communities for-profits won't touch.
For some hospitals this is true. Academic medical centers take complex cases. Rural critical-access hospitals serve communities no for-profit chain would enter. The analysis treats them accordingly: a hospital that operates at a loss has no federal income tax to forgo, so the federal component of its exemption is zero in our math, and most of these safety-net hospitals pass the broad test.
The bigger structural issue is Medicaid shortfall, the largest single piece of the broad-test community benefit. Hospitals self-report it on Schedule H, and the same patient at the same hospital can produce a different "shortfall" depending on the hospital's cost accounting. Bai and colleagues have documented hospitals reporting widely different Medicaid shortfall numbers from similar Medicaid populations. That is why the audited charity-care test (where 86 percent of nonprofits fail) matters even more than the self-reported broad-subset test (where 44 percent fail). The narrow test sits on an audited number; the broad test sits partly on a number the hospital itself defines.
What we book
We book $5.38 billion per year. Here is the math.
The raw gap on the broad test is $11.9 billion: that is the sum of how much each individual nonprofit's exemption exceeds its individual community benefit, for the hospitals where exemption is the larger number. From that we subtract two overlaps with prior issues: 5 percent goes to commercial-pricing reform already booked in Issue #3: The 254% Problem, and 10 percent goes to merger-power pricing already booked in Issue #12: The Consolidation Tax. That leaves $10.1 billion in non-overlapping gap. We then multiply by 53 percent, our central estimate of what would actually be recovered if the fixes below were enacted: a fix that requires Congress, fifty state legislatures, and IRS enforcement does not pull back 100 percent. The result is $5.38 billion.
Sensitivity: at 40 percent recoverability, $4.06 billion. At 70 percent, $7.11 billion.
What would tighten this number
About 46 percent of the nonprofit hospitals in this analysis were matched to their own Form 990 filings. The other 54 percent fall to an audited charity-care figure with a sector-average estimate for the broader categories. The fallback is honest, but it is also coarse.
If you work with audited state community-benefit data (Massachusetts CHIA, California HCAI, Illinois Department of Revenue, New Jersey DOH, Pennsylvania AG filings) or with the AHA Annual Survey system-affiliation flag that would close the federal-state matching gap, we would like to hear from you: contact@ahcdata.fund.
Who Profits
Five systems carry an outsized share of the $46.4 billion tax shield. Four are large nonprofits; one is the for-profit comparison case.
Kaiser Foundation Hospitals (private nonprofit)
FY2023 Revenue: ~$100B | Operating Margin: ~3-4% | CEO Comp (Greg Adams): ~$31M
Mechanism: Kaiser filed a single Form 990 covering all 43 of its hospitals, reporting $1.32 billion in total Schedule H community benefit. One disclosure for 43 facilities is the canonical version of the problem this issue describes. Whether each individual hospital delivers community benefit proportional to its own tax exemption is invisible at this filing level.
CommonSpirit Health (private nonprofit, 137 hospitals)
FY2024 Operating Revenue: ~$37B | Operating Margin: negative (~$875M operating loss) | CEO Comp (Wright Lassiter III): ~$17M
Mechanism: As a loss-maker, CommonSpirit owes no federal income tax, so that component of its exemption is already zero. But the property tax, sales tax, and state income tax components are not. Across 137 facilities in 24 states, the property-tax exemption alone is a material annual benefit that persists regardless of whether the operating side breaks even.
UPMC (private nonprofit, 40 hospitals)
FY2024 Revenue: ~$28B | Operating Margin: ~3-5% | CEO Comp (Leslie Davis): ~$11M
Mechanism: In February 2019, Pennsylvania Attorney General Josh Shapiro petitioned the Commonwealth Court to modify the consent decrees governing UPMC, alleging it was avoiding roughly $40 million per year in property taxes that its charitable mission did not justify. The case settled in July 2019 with a 10-year consent decree on insurance access, but with no quantitative community-benefit floor. UPMC also owns its own insurance arm, which raises the same vertical-integration questions covered in Issue #8: The Denial Machine.
Ascension Health (private nonprofit Catholic, 140 hospitals)
FY2024 Revenue: ~$28B | Operating Margin: ~1-2% | CEO Comp (Joseph Impicciche): ~$9M
Mechanism: One of the largest Catholic health systems in the country, Ascension files a consolidated Form 990 across 19 states. Several states have opened community-benefit-compliance investigations into Ascension's local properties in recent years. The federal filing aggregates so much across so many facilities that state regulators end up doing the audit that the IRS does not.
HCA Healthcare (publicly traded, NYSE: HCA — for-profit comparison)
FY2024 Revenue: $70.6B | Operating Margin: ~13% | CEO Comp (Sam Hazen): ~$24M | Stock Buybacks (2020-24): ~$14B | Lobbying (2020-24): ~$28M
Mechanism: HCA is the load-bearing comparison in this analysis, not a target. It pays full federal, state, and property taxes. It gets no tax-exempt bond subsidy. Donations to it are not deductible. And on our FY2023 panel, its audited HCRIS charity-care share is 3.14% of operating expenses, against the nonprofit-hospital average of 1.86%. The for-profit chain paying all its taxes delivers more charity care per dollar than the average nonprofit hospital that pays none.
Sources: Form 990 filings via IRS bulk XML (apps.irs.gov) for Kaiser, CommonSpirit, UPMC, and Ascension; Electronic Municipal Market Access bond disclosures (emma.msrb.org); Pennsylvania Office of the Attorney General v. UPMC consent decree (attorneygeneral.gov/upmc/); HCA Healthcare FY2024 Form 10-K and DEF 14A proxy via SEC EDGAR; OpenSecrets.org federal lobbying disclosures (2020-2024); CMS HCRIS HOSP10 FY2023 Worksheet S-10 (charity care at cost).
The Fix
The enforcement gap is real, but not inevitable. Three tiers of intervention can close it. They go from easiest to hardest.
Tier 1: Scale the penalty to the gap.
Today, the IRS penalty for a hospital that fails its Community Health Needs Assessment is $50,000. That is roughly what one patient might owe after a single hospital stay in a high-cost market. It does not deter anyone. A penalty set at, say, 25 percent of each hospital's individual fair-share gap would scale with the size of the problem and create an actual financial incentive. The IRS named hospital tax-exempt examination as a 2025 strategic priority, so the administrative infrastructure to apply it already exists.
This is also bipartisan territory. In August 2023, Senators Warren, Warnock, Cassidy, and Grassley sent a joint oversight letter to the IRS asking for exactly this kind of accountability. The question of whether the tax code's hospital exemption is doing what it promises is one both progressive and conservative policymakers have raised.
Tier 2: State-level minimum charity care floors.
Several states have already moved ahead of the federal framework.
Massachusetts requires hospitals to file annual Community Benefit Reports with the state, and the Attorney General has authority to enforce community-benefit commitments. Illinois has a 2010 state supreme court ruling (Provena Covenant Medical Center v. Department of Revenue) that requires hospitals to demonstrate actual charitable purpose to qualify for the property-tax exemption, not just nonprofit organizational status. Pennsylvania's Attorney General has charitable-trust authority and used it against UPMC in 2019.
The Tier 2 fix extends these models: each state legislates a minimum charity-care floor as a condition of state property-tax exemption, pegs it to the dollar value of that hospital's local tax shield, and audits against CMS cost-report data instead of hospital-self-reported figures.
Tier 3: Rebuild the property-tax exemption as targeted public funding.
The property-tax piece is the most locally contested ($9.7 billion in our panel). Categorical exemption converts a public benefit (taxes forgone) into a private endowment (the system keeps it). There is no mechanism to recapture value if the hospital does not deliver.
The structural fix is to replace the categorical 501(c)(3) property-tax exemption with explicit public funding. A federal or state grant program that pays hospitals directly for documented charity care (at, say, Medicaid cost plus a fixed overhead) would convert the implicit subsidy into a transparent appropriation. Hospitals that deliver get the grant. Hospitals that do not, do not. This is the heaviest political lift, because appropriations are visible in the budget in a way that tax forgone is not. It is also the cleanest: the subsidy goes where the benefit goes, and the benefit is auditable.
The three tiers stack. Tier 1 needs an act of Congress to change the penalty schedule. Tier 2 needs fifty state legislatures, in sequence, though the legal precedent already exists in Illinois and the enforcement template exists in Pennsylvania and Massachusetts. Tier 3 needs Congress and state budget reforms together. None of them require new legal authority that does not already exist somewhere in the system. They require political will to use the authority.
What's Next
Issue #14: The Specialist Tax. Publishing May 31, 2026.
US physician compensation is the highest in the Organisation for Economic Co-operation and Development (OECD). Specialists earn roughly twice what their peers earn in Germany or France at purchasing power parity, and the US workforce skews far more heavily toward specialty than peer nations do. The mechanism is the CMS Physician Fee Schedule and the Relative Value Scale Update Committee (RUC) that recommends its rates, plus a Graduate Medical Education funding formula that subsidizes specialty residencies more than primary-care ones, plus a medical-education debt structure that turns specialty choice into a debt-payback calculation. Issue #14 measures the per-specialty pay premium and the workforce-mix counterfactual, with explicit treatment for the system pressures physicians face that they did not create. The villain is the payment architecture, not the people who chose medicine.
Every script is on GitHub. Every number can be verified. If you think we got something wrong, open an issue: github.com/rexrodeo/american-healthcare-conundrum
If you found value in this work, forward it to someone who should see it.
[Subscribe to The American Healthcare Conundrum]
Sources: Plummer/Socal/Bai 2024 (JAMA, DOI 10.1001/jama.2024.13413); Bai/Yehia/Chen/Anderson 2021 (Health Affairs 40(4):629-636, DOI 10.1377/hlthaff.2020.01627); Herring/Gaskin/Zare/Anderson 2018 (Inquiry 55, DOI 10.1177/0046958017751970); Bai/Letchuman/Hyman 2023 (NEJM 389(3):196-197, DOI 10.1056/NEJMp2303245); Bai et al. 2023 (Health Affairs, DOI 10.1377/hlthaff.2022.01542); Bai/Letchuman/Anderson 2022 (JAMA Netw Open 5(2):e2148878); Lown Institute Hospital Index 2024 (lownhospitalindex.org); EY/AHA 2024 community benefit report (aha.org); CMS HCRIS HOSP10 FY2023 (Worksheets S-10 and A); IRS Form 990 bulk XML FY2023 (apps.irs.gov); Pennsylvania OAG v. UPMC consent decree 2019 (attorneygeneral.gov/upmc/); Provena Covenant Med Ctr v. IDOR 236 Ill. 2d 368 (2010); Massachusetts CHIA FY2024 Community Benefits Report (chiamass.gov); House Ways and Means hearings September 2025; Warren-Warnock-Cassidy-Grassley oversight letter August 2023.
Cumulative savings identified: $489.2 billion per year. That's 15.1% of the $3.24 trillion gap between US and Japan per-capita healthcare spending.
- Issue #13 booked: $5.38B (range $4.06-$7.11B). Narrow-test raw gap: $31.3B. Broad-test raw gap: $11.9B (hospitals falling below their individual tax exemption on the broad conservative subset). After overlap subtractions (Issue #3: 5% of $11.9B = $0.60B; Issue #12: 10% of $11.9B = $1.19B), non-overlapping base: $10.1B. Central recoverability factor: 53% (range 40%-70%). Booked central: $5.38B.
- Tax exemption aggregate: $46.4B across 3,005 nonprofit hospitals (FY2023). Components (Plummer/Socal/Bai 2024 method): federal income tax $17.0B (36.6%), sales tax $11.4B (24.6%), property tax $9.7B (20.9%), state income tax $4.8B (10.3%), bond financing $2.4B (5.2%), charitable deduction $1.0B (2.2%), FUTA $0.1B (0.2%). Property tax, bond interest subsidy, and sales tax are computed at uniform national/state rates applied to per-hospital expenses, following the Plummer/Socal/Bai 2024 component method. Direct per-property and per-purchase data would tighten these estimates but does not change the order of magnitude established in the literature.
- Schedule H coverage: 1,378 hospitals matched to per-filer Schedule H Part I via same-state-enforced EIN-to-CCN crosswalk (45.9% of panel by count); 1,627 hospitals fallback to HCRIS S-10 charity multiplied by sector-average uplift (54.1% by count, flagged per-row in gap_panel.csv). Of the booked $5.38B, the fallback bucket (24% of panel expenses) accounts for approximately 32% of the raw gap pool. The fallback rate reflects the limits of publicly available crosswalk data; AHA Annual Survey (gated) carries a definitive system-affiliation flag that would close the EIN-to-CCN matching gap. State-level adjudicated community benefit data (MA CHIA, NJ DOH, CA HCAI, IL DOR, PA AG) would replace self-reported Schedule H with audited or contested figures. Schedule H Part V facility-level breakdowns would decompose multi-facility consolidated filings (Kaiser 43 facilities, CommonSpirit 137) into per-facility numbers rather than expense-share allocations.
- Charity-share by ownership (HCRIS Worksheet S-10 audited charity at cost as % of Worksheet A total operating expenses, FY2023 panel): government 3.56%, for-profit 3.14%, nonprofit 1.86%. Reproduces Bai/Yehia/Chen/Anderson 2021 ordering (government 4.1%, for-profit 3.8%, nonprofit 2.3%) on FY2023 data.
- Narrow-test fail rate ~86% reproduces Herring 2018 (86%) within rounding on the FY2023 panel.
- Overlap accounting: 5% of raw broad-test gap attributed to Issue #3 commercial reference pricing flow-through; 10% attributed to Issue #12 post-merger consolidation pricing power. Both are conservative, deducted from the booking base per ROADMAP overlap rule #10 (Hospital Structural Extraction Cluster).
- Plummer aggregate: our FY2023 panel produces $46.4B vs. the Plummer 2021 figure inflated to 2023 of $42.6B, a +8.8% delta. Structural driver: 2023 nonprofit hospital operating margins recovered from pandemic-era lows; higher net income inflates the federal income tax component. The federal income tax share in our panel (36.6%) is higher than Plummer's 31%. Documented in issue_13/results/methodology.md.
- EY/AHA comparison: EY/AHA 2024 reports a 10:1 community-benefit-to-federal-tax-exemption ratio. That ratio uses (a) federal tax exemption only ($13.2B in 2020, which is 31% of total per Plummer) as the denominator and (b) the full Schedule H total including research, education, and bad debt ($129B in 2020) as the numerator. Using the Plummer full-exemption denominator and the Bai/Yehia/Chen/Anderson conservative subset as numerator, our panel-level ratio is approximately 1.52:1. The difference is denominator and numerator scope, not a methodology error.
- Medicaid shortfall note: the $44.1B aggregate Medicaid shortfall across matched Schedule H filers is self-reported and not independently audited. Research by Bai and colleagues has documented that hospitals can report different Medicaid shortfall figures depending on their cost-to-charge ratio assumptions. The narrow test (86% fail rate) uses only HCRIS S-10 audited charity care and is not subject to this issue. The booked $5.38B uses the broad test including Medicaid shortfall; this is the Bai/Yehia/Chen/Anderson academic-consensus standard.
- Prior cumulative after Issue #12 (published May 2026): $483.8B. Issue #13 adds $5.38B. New cumulative: $489.2B / $3.24T = 15.1%.
- Denominator: $3.24 trillion US-Japan per-capita spending gap (US per-capita $15,474, Japan $5,790, US population approximately 336 million; CMS NHE 2024 final, Organisation for Economic Co-operation and Development Health at a Glance 2025).
The American Healthcare Conundrum publishes when the data is ready. All analysis uses publicly available data. Code is open-source. Figures are validated before publication.
Get every issue in your inbox
The American Healthcare Conundrum is free. One fixable problem in U.S. healthcare, with the data, every week.