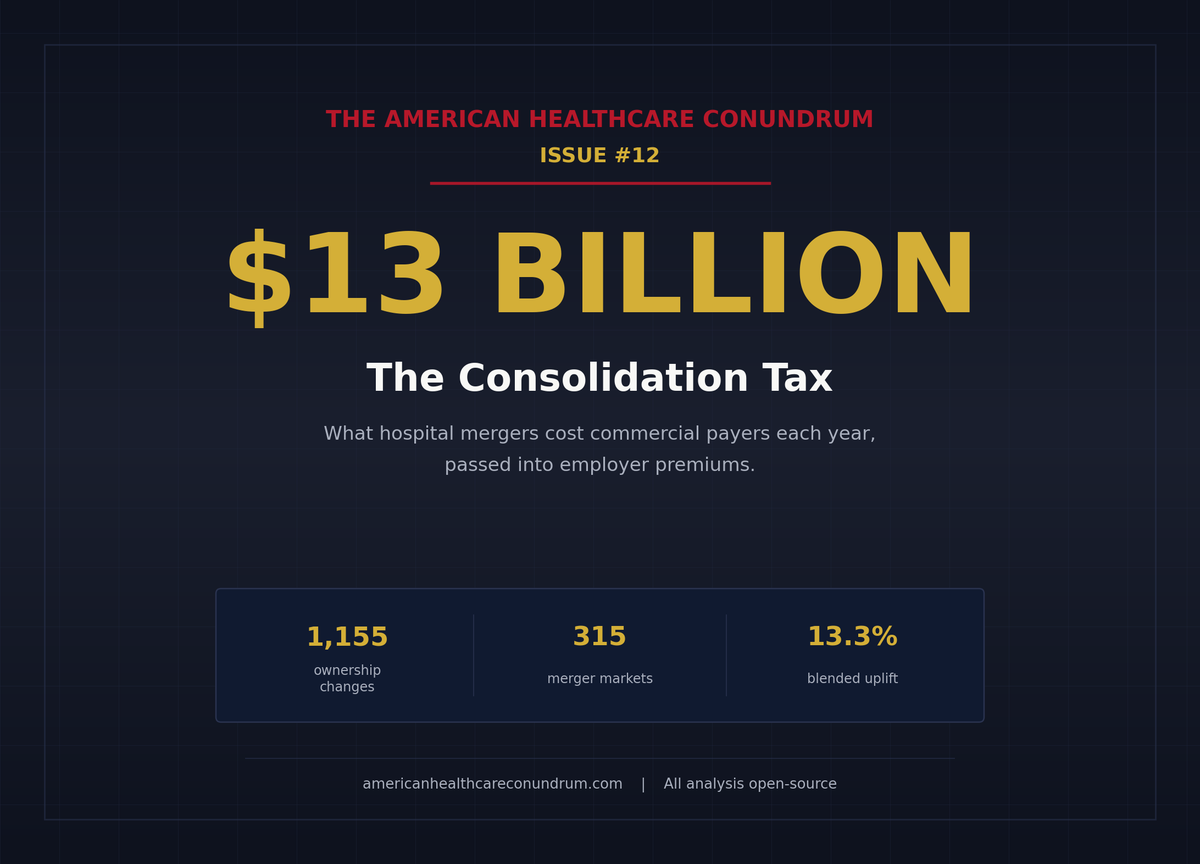
Issue #12: The Consolidation Tax
How hospital mergers raise commercial prices and pass $13 billion per year into employer premiums
Each issue of The American Healthcare Conundrum identifies one fixable problem in U.S. healthcare spending, builds the data case, and recommends a specific policy fix. All analysis uses publicly available data. Code is open-source.
Target: ~$3.24T US-Japan per-capita spending gap
(Japan: highest life expectancy, lowest infant
 mortality in OECD, ~half US per-capita spend)

Full scale: $0 ───────────────────────── $3.24T
            ████░░░░░░░░░░░░░░░░░░░░░░  14.9%
            ↑ $483.8B identified

Per-issue savings (1 block ≈ $8B; max bar = $200B):
 #1 ▏                          $0.6B   OTC Drug Overspending
 #2 ███                       $25.0B   Drug Pricing
 #3 █████████                 $73.0B   Hospital Pricing
 #4 ████                      $30.0B   PBM Reform
 #5 █████████████████████████ $200.0B  Admin Waste
 #6 ███                       $28.0B   Supply Waste
 #7 █████                     $40.0B   GLP-1 Pricing
 #8 ████                      $32.0B   Denial Machine
 #9 █                          $6.6B   Employer Trap
#10 █                          $7.6B   Procedure Mill
#11 ████                      $28.0B   MA Overpayment
#12 ██                        $13.0B   Consolidation Tax (this issue)
   ────────────────────────────────────────────────
   Total: $483.8B  ·  $2,756.2B remaining
   Scale: $3.24T (CMS NHE 2024; Japan OECD 2023)
In recent years, two hospitals in a mid-sized American city merged. Before the merger, when the dominant insurer in that market sat down to renegotiate its hospital contract, it had two competing facilities to play against each other. After the merger, it had one. The merged hospital's management understood this. So did the insurer's contracting team. What happened next is not a secret: the next contract cycle produced higher commercial rates. The insurer passed the increase into premiums. The large employer across town absorbed the premium increase and, as employers have done for thirty years, offset it by suppressing the next wage cycle.
Nobody sent a bill labeled "consolidation surcharge." The cost landed on the household as slightly slower wage growth and a slightly higher deduction from the paycheck. Issue #9: The Employer Trap measured what happens to wages after that premium hits the employer. This issue measures where the premium increase comes from in the first place.
Two Hospitals Become One
US hospitals, physician groups, and insurers have consolidated at a pace that would have triggered antitrust review in nearly any other industry. By 2019, 67 percent of US community hospitals were part of a health system, up from 10 percent in 1970, according to Fulton, Arnold, King, Greaney, and Scheffler writing in Health Affairs in 2022. Of the 368 active systems in 2019, 216 were cross-market, meaning they owned hospitals in multiple commuting zones rather than just one. Of the 1,500 hospitals targeted for acquisition between 2010 and 2019, 55 percent were in a different commuting zone from the acquirer. This is not a story about local competition. It is a story about regional and national market power assembled hospital by hospital over three decades.
The physician side is moving in the same direction. Private practice's share of physician employment fell from 60.1 percent in 2012 to 42.2 percent in 2024, per the American Medical Association (AMA) Physician Practice Benchmark Survey. The share of physicians directly employed by hospitals rose from 5.6 percent to 12.2 percent over the same period. Optum Health, UnitedHealth Group's physician-employment arm, now employs roughly 90,000 physicians. That vertical integration story is part of the same wave, and an upcoming issue (Issue #15: The Facility Fee Scam) will quantify it directly. When a hospital buys a physician practice, the same services start billing at hospital outpatient rates instead of office rates, with markups often two to four times higher. That dollar figure is Issue #15's territory.
This issue focuses on the horizontal hospital story: when two hospitals in the same or adjacent market merge, what happens to the commercial prices that self-insured employers and their insurers pay?
The academic literature has a consistent answer. Our analysis applies that answer to the post-2019 merger wave, using a panel of 1,155 ownership-change events identified from public Centers for Medicare and Medicaid Services (CMS) data across 2018 through 2025.
The Mechanism
The mechanism has four links. Understanding each one matters because the policy fix needs to target the link most likely to break under pressure.
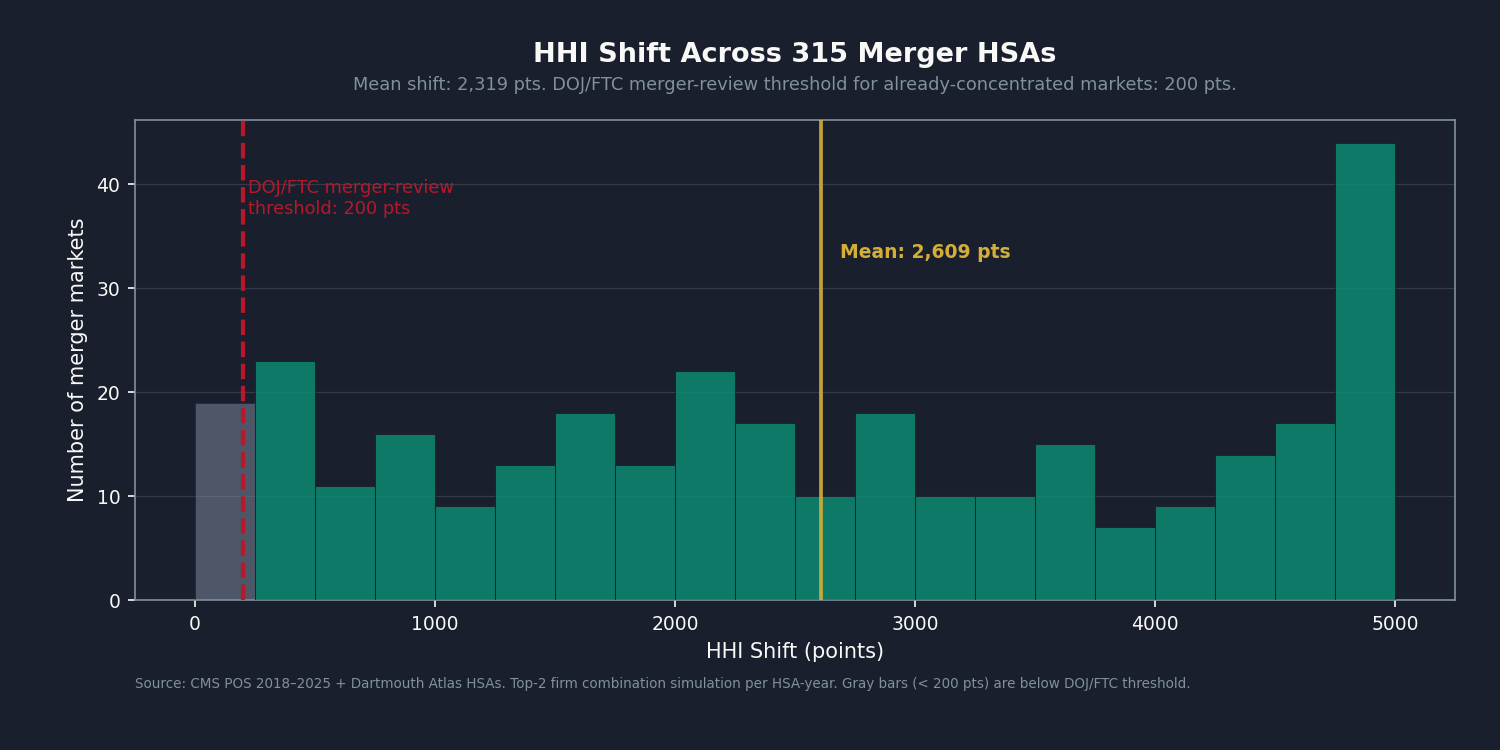
Link 1: Merger raises local market concentration. The Herfindahl-Hirschman Index (HHI) is the Department of Justice (DOJ) and Federal Trade Commission (FTC) standard measure of market concentration. Markets with HHI above 2,500 are highly concentrated under the DOJ/FTC 2023 Horizontal Merger Guidelines; markets that shift by more than 200 points are presumed to be anticompetitively affected. When two hospitals in a market with three total hospitals merge, the HHI shift is not marginal. In the 315 unique Hospital Service Areas (HSAs) in our panel where at least one horizontal merger occurred, the mean HHI shift at the HSA level was 2,318 points.
Link 2: Concentration raises commercial prices. Commercial insurers and self-insured employers renegotiate hospital contracts on rolling one-to-three-year cycles. A merged entity has more leverage at the table: the payer that formerly played two hospitals against each other cannot walk away from the only hospital in the area. The published literature on the price effect is described in the analysis section below.
Link 3: Price increase passes into premiums. Fully-insured plans pass the increase directly into the next year's rate filing. Self-insured plans under administrative services only (ASO) arrangements absorb it as higher claims and higher stop-loss premiums. Fiduciary oversight of this pass-through is thin, per the Form 5500 analysis in Issue #9: The Employer Trap.
Link 4: Premium increase suppresses wages. This is the territory of Issue #9 and of the Brot-Goldberg, Cooper, Craig, Klarnet, Lurie, and Miller 2024 National Bureau of Economic Research (NBER) working paper: a 1 percent increase in healthcare prices lowers payroll and employment at non-healthcare employers by 0.4 percent. The average merger that raised prices 5 percent or more leads to roughly 203 job losses and $32 million in forgone wages per event. This issue measures Link 2. Issue #9 measured Links 3 and 4.
The Math: Four Anchors, One Band
Four Published Coefficients
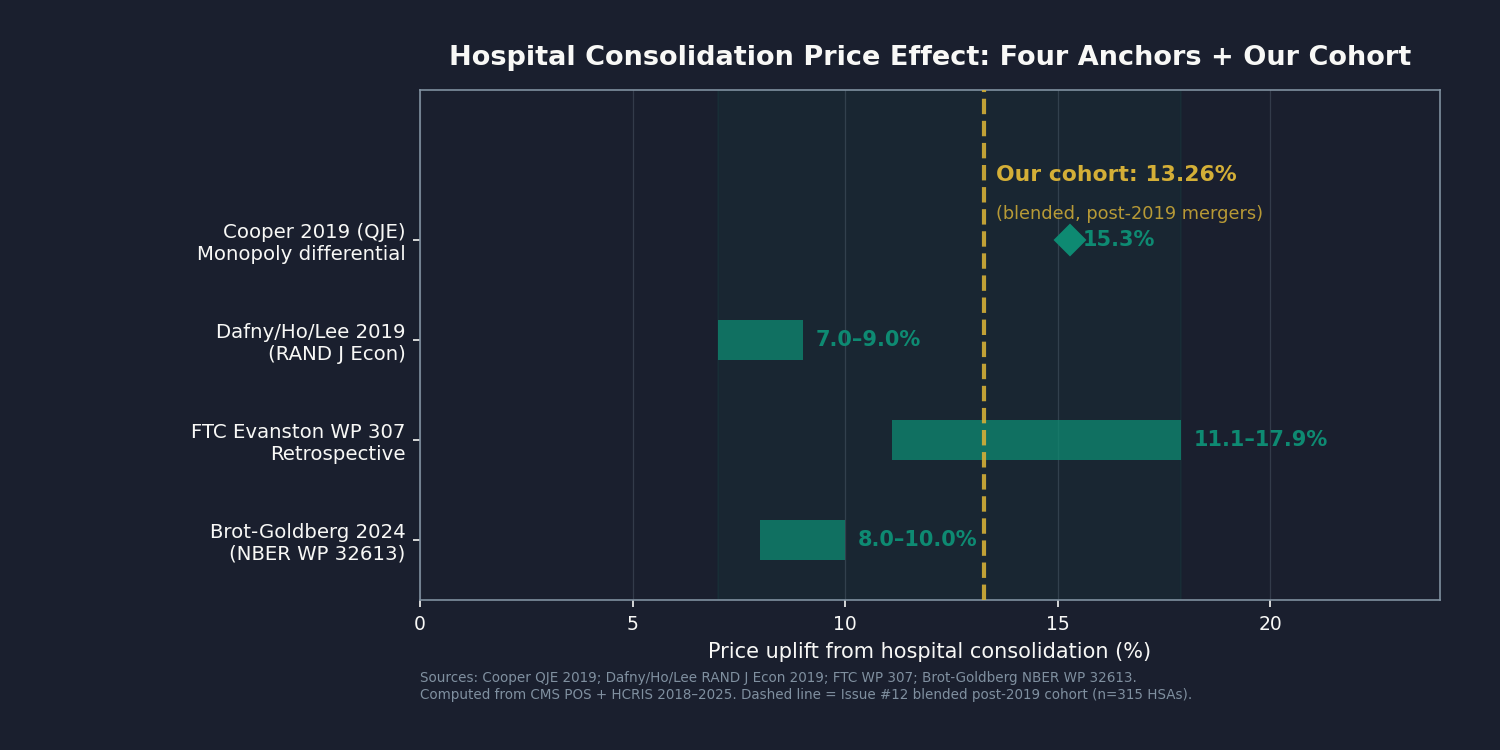
The price effect of hospital consolidation has been studied from multiple angles. We use four anchor estimates, each using different data and a different identification strategy:
Cooper, Craig, Gaynor, and Van Reenen, Quarterly Journal of Economics (QJE), 2019. Monopoly hospital markets (HHI above 5,000) charge commercial payers 15.3 percent more than markets with four or more hospitals, using Health Care Cost Institute (HCCI) commercial claims data from 2008 through 2012. This is a level comparison: the monopoly market charges 15.3 percent more, not that a merger raises prices by 15.3 percent. It is the upper bound for markets where consolidation has gone to completion.
Dafny, Ho, and Lee, RAND Journal of Economics, 2019. Cross-market, within-state hospital mergers (where the merging hospitals are not in the same local market but within the same state) raise prices 7 to 9 percent for acquiring hospitals, using carrier claims and the American Hospital Association (AHA) Annual Survey Database, sample period 1996 through 2012. Out-of-state acquisitions show no statistically significant price increase.
FTC Evanston Northwestern retrospective, Working Paper 307. The FTC's retrospective study of the Evanston Northwestern Hospital/Highland Park merger found that inpatient prices rose 11.1 to 17.9 percentage points more than at control hospitals post-merger. The administrative law judge ruled the merger anticompetitive in 2005; the Commission upheld that ruling in 2007. The FTC tested the efficiency defense directly and rejected it.
Brot-Goldberg, Cooper, Craig, Klarnet, Lurie, and Miller, NBER Working Paper 32613, 2024 (revised February 2026). The post-2019 update, co-authored by the Cooper 2019 lead author, uses Treasury IRS administrative tax records linked to commercial healthcare claims. On the post-2019 merger cohort, the blended weighted-average uplift is consistent with the Cooper monopoly-market coefficient for the concentrated-market subset.
The four anchors bracket a range of approximately 5 to 17 percent post-merger price uplift across the merger types and market structures in the published literature. That is the band. The booked $13 billion is the central piecewise-weighted result applied to our merger panel.
How We Got to $13 Billion
We pulled the federal government's annual list of every US hospital from 2018 through 2025 and tracked which ones changed hands. That gave us 1,155 ownership changes across the seven years. About half (530) were hospital-on-hospital consolidations: the kind where two hospitals in the same area merge, or a regional system buys a local competitor. The rest were tax-status conversions and government transitions, which we set aside for an upcoming issue (Issue #13: The Nonprofit Lie) to address separately.
For each consolidation, we mapped the hospital to its local market using the standard federal definition (a Hospital Service Area). We measured how concentrated that market was before the merger, and how much more concentrated it became after. Then we applied the published price-effect coefficients from the four anchor studies above. Hospitals in markets that became near-monopolies after merger got the Cooper coefficient. Markets that became more concentrated but still had competition got a smaller number. Markets that stayed roughly competitive got the smallest.
We allocated commercial insurance spending to each hospital using federal cost-report data, calibrated against the national total of private-insurance hospital spending (about $595 billion in 2024 per the CMS National Health Expenditure tables). The merger markets in our panel carry roughly $218 billion of that.
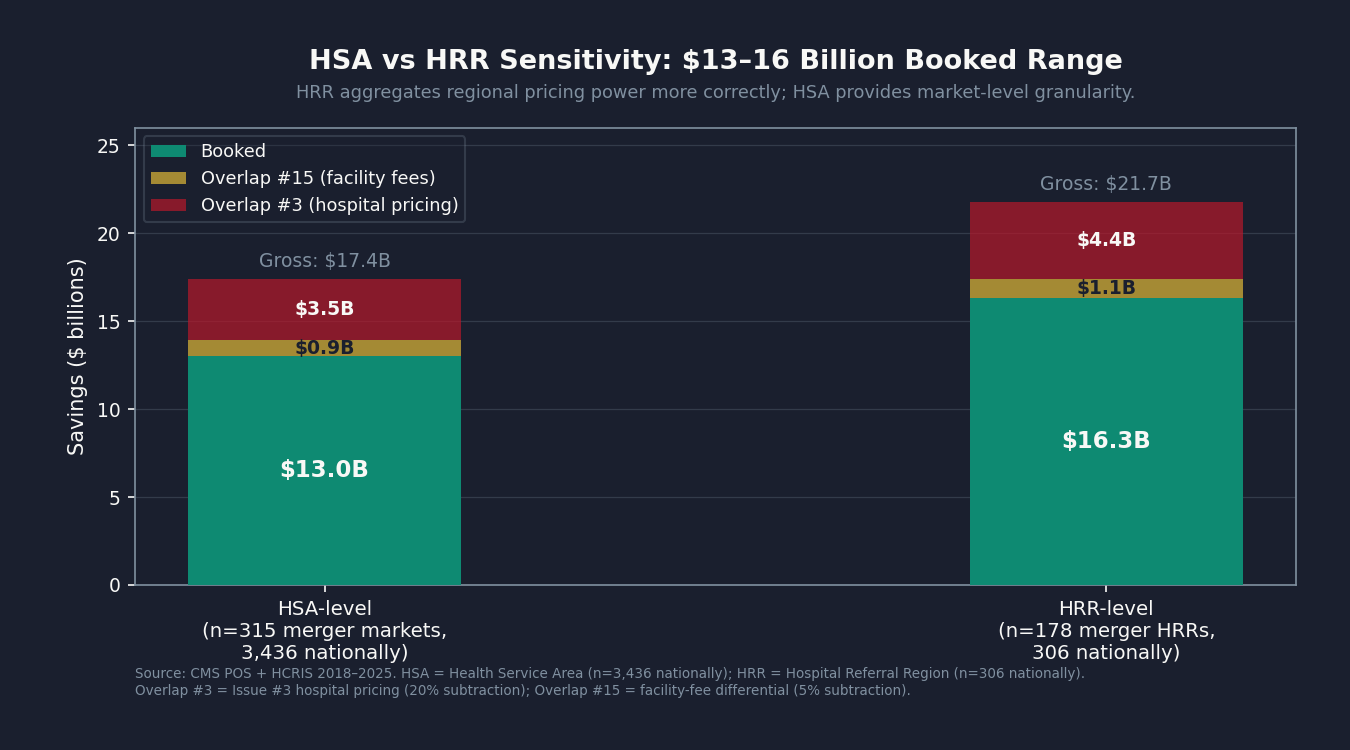
Gross savings before any overlap adjustments: about $17 billion. From that we subtract about $3.5 billion to avoid double-counting the price compression already booked in Issue #3: The 254% Problem (commercial rates capped at 200 percent of Medicare). We also set aside about $0.9 billion that an upcoming issue (Issue #15: The Facility Fee Scam) will quantify directly. Net booked: $13 billion per year.
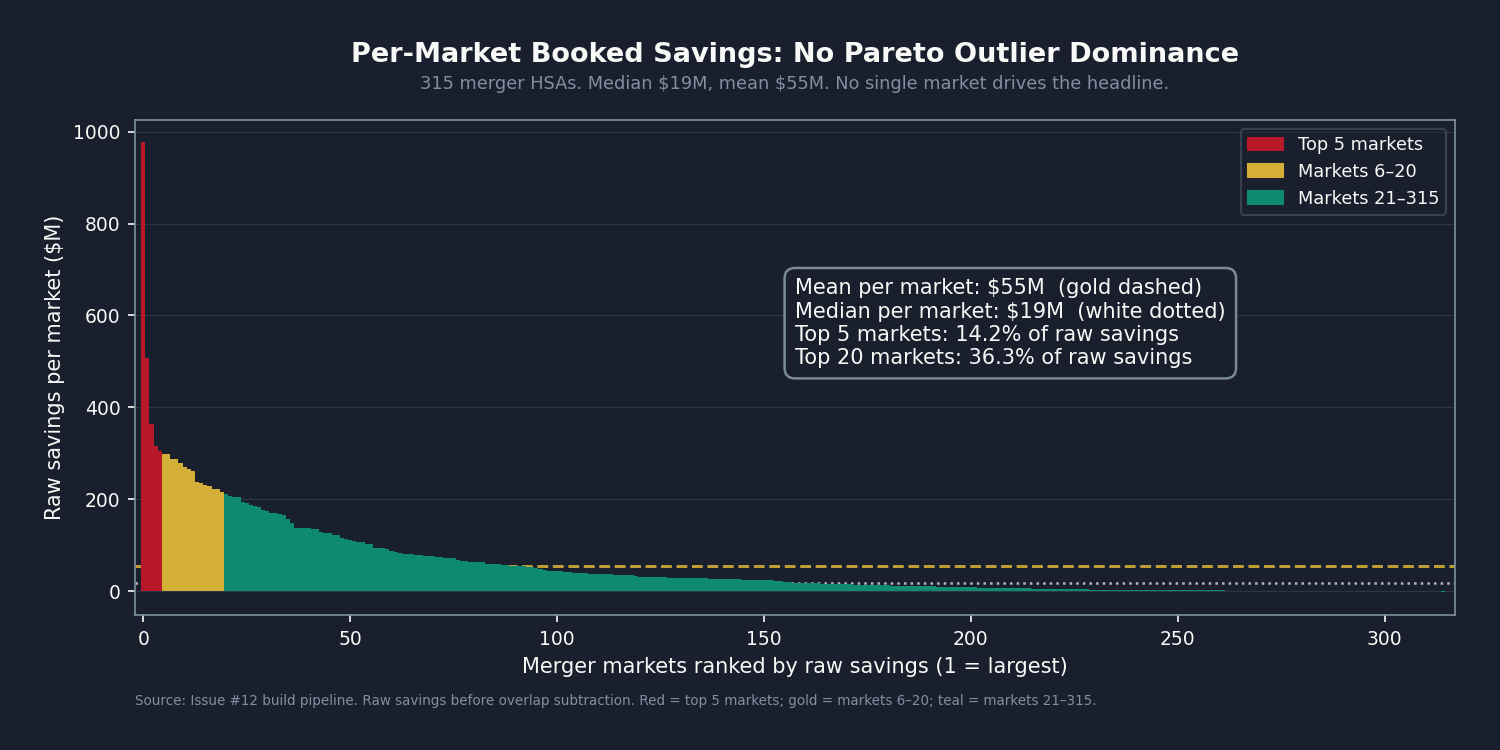
The $13 billion is broadly distributed across markets, not concentrated in a handful of large transactions. The top five markets together account for roughly 14 percent of the total. The top 20 carry about 36 percent. No single hospital merger drives the headline.
How Our Number Compares to the Published Studies
On the subset of mergers that pushed markets into near-monopoly territory, we land at Cooper's 15.3 percent by construction. On cross-market mergers, we get Dafny's 8 percent. The FTC Evanston retrospective range we land inside.
The Brot-Goldberg comparison is the interesting one. Their national average across the post-2019 merger wave is roughly 9 percent. Ours is about 13. That four-point gap is not a mistake. Most of the mergers in our window happened in markets that were already concentrated to begin with: 222 of the 315 markets in our panel (around 70 percent) ended up at near-monopoly concentration after merger. When two of three hospitals in a metro area combine, the resulting price effect lands in Cooper territory rather than Dafny territory. The post-2019 wave concentrated already-concentrated markets, and our blended average reflects that pattern.
What We Can and Cannot Say
Two things are worth being upfront about.
First, the market definition matters. We used the federal Hospital Service Area, which is small enough that many areas in our panel contain only two or three hospitals. When two of three hospitals merge, the resulting concentration measure looks dramatic, and the price-effect coefficient we apply is correspondingly high. To check whether that's an artifact of the small-area definition, we re-ran the same analysis at the larger Hospital Referral Region level (306 regions instead of 3,436 areas). The result there is $16 billion instead of $13 billion. The two numbers bracket what we can confidently say from public data: the consolidation tax is roughly $13 to $16 billion per year.
Second, our coefficient comes from published research that used commercial insurance claims data we don't have access to. Cooper used the Health Care Cost Institute. Dafny used FAIR Health. Brot-Goldberg used Treasury IRS records linked to commercial claims. All restricted-access. The original work in this issue is the panel construction and the application to the 2018-through-2025 merger wave, not the price-effect coefficient itself. Re-estimating that coefficient on the post-2019 cohort directly would require access to one of those claims datasets, or to the state All-Payer Claims Databases (Colorado, Massachusetts, Oregon, New Hampshire, Washington) that hold a substantial slice of commercial claims. With direct access, the booked figure could plausibly land anywhere in the $13 to $30 billion range we report.
If you work with one of those datasets and want to help refine the coefficient on the post-2019 wave, we're open to that partnership: contact@ahcdata.fund.
The Industry Response
The hospital and insurer lobbies have well-rehearsed answers to consolidation research. They have been deployed against Cooper, Dafny, and the FTC retrospectives for twenty years. The four most likely responses to this issue:
"Mergers create efficiency." The efficiency claim is the first answer in every AHA and Federation of American Hospitals response to consolidation literature. It has been tested. Beaulieu, Dafny, Landon, Dalton, Kuye, and McWilliams examined 246 acquired hospitals against 1,986 controls in the New England Journal of Medicine (NEJM) in 2020 and found no improvement in 30-day readmission, no improvement in mortality, and modest deterioration in patient experience. The FTC's Evanston retrospective tested the efficiency defense directly, with the merged entity's own documentation, and rejected it. The empirical record over twenty years is consistent: hospital mergers raise commercial prices and do not improve measurable quality. If efficiencies exist, they are not reaching patients or commercial payers.
"Scale is required for EHR investment and value-based care." The infrastructure argument has an empirical record too. The U.S. Department of Health and Human Services (HHS) HITECH Act (2009 through 2019) funded electronic health record (EHR) adoption directly across hospitals of all sizes; the post-HITECH adoption curve crossed 90 percent at rural and standalone hospitals without consolidation. If the scale defense were correct, the post-merger period should show measurable improvements in the quality metrics that scale is supposed to enable. Beaulieu and coauthors looked for those improvements and found none.
"Rural hospitals need merger lifelines or they will close." The rural exception is the most important carve-out in any serious antitrust policy. Rural hospital closures are real, and an antitrust posture that ignored rural distress would accelerate them. But the data answers the question of whether the post-2019 merger wave is rural rescue. Fulton and coauthors found that 55 percent of the 2010-to-2019 acquisition targets were in different commuting zones from the acquirer. Cross-market acquisitions average substantial geographic separation between acquirer and target. The dominant pattern is suburban consolidation, not rural rescue. The policy fix described below carves out a fast-track pathway for genuine rural-rescue cases. The carve-out is narrow by design: closure-imminence test, sole-community-provider test, and a price commitment. That carve-out does not protect the larger pattern.
"You cannot measure the counterfactual without claims data." This critique is partially correct, and the analysis owns it. The coefficient is not the original contribution here. It comes from Cooper (HCCI claims), Dafny (FAIR Health carrier claims), and Brot-Goldberg (Treasury IRS linked claims), all restricted-access data we did not and cannot replicate. The panel construction, the market-level HHI computation, and the application to the 2018-through-2025 merger cohort are the original work. State APCDs and HCCI commercial claims would let anyone re-estimate the coefficient from the post-2019 cohort directly. We are open to that partnership.
"AHA Annual Survey would change the numbers." Partially correct. The POS chain-affiliation field is incomplete, and our bed-count market-share proxy misses some within-system common ownership. The net direction is defensible conservatism: smaller mergers that are harder to detect in POS are likely understated; some hospitals already in the same system that POS doesn't fully flag as affiliated may produce spurious HHI shifts. AHA ASDB access via WRDS is the refinement ask.
Who Profits
Consolidation isn't unique to for-profit hospitals or nonprofit ones. The systems below cover four different ownership models, but all benefit from the same underlying dynamic: fewer competitors at the contract table mean higher commercial rates at the next renegotiation.
Who Profits: HCA Healthcare (HCA) FY2024 Revenue: $70.6B | Operating Margin: ~13% | CEO Comp (Sam Hazen): ~$24M | Stock Buybacks (2020-24): ~$14B | Lobbying (2020-24): ~$28M This issue's mechanism: HCA operates a "metro hub" strategy, acquiring competing hospitals within the same metropolitan statistical area to assemble regional dominance. Mission Health in Asheville (2019), Brookwood Baptist in Birmingham (2020), and North Cypress in Houston (2024) are recent examples of acquisitions that reduced local competition. As the largest for-profit chain with 182 hospitals across 20 states, HCA's contract renegotiation leverage in markets it has consolidated is the clearest illustration of the mechanism this issue measures. HCA was profiled in Issue #3: The 254% Problem on chargemaster pricing; here the mechanism is the market-structure pricing power those acquisitions create, not the rate card in isolation.
Who Profits: CommonSpirit Health (private nonprofit) FY2024 Revenue: ~$40B (Form 990 and EMMA municipal-bond filings; private nonprofit) | Operating Margin: ~1-2% | CEO Comp (Wright Lassiter III): publicly disclosed in Form 990 This issue's mechanism: CommonSpirit was formed by the 2019 merger of Catholic Health Initiatives and Dignity Health, creating the second-largest nonprofit hospital system in the US with approximately 140 hospitals across 24 states. That formation was itself a cross-market merger of the type Fulton and coauthors identify as most associated with commercial-rate pricing power: the merged entity now negotiates in markets across multiple commuting zones, with no local competitor able to contest its rates in many of them. CommonSpirit's market-level negotiating leverage is structural, not operational. An upcoming issue (Issue #13: The Nonprofit Lie) will address the tax-exemption question for systems like this one; this issue measures what the merger did to commercial pricing.
Who Profits: Advocate Health (private nonprofit) FY2024 Revenue: ~$27B (Form 990 and EMMA filings; private nonprofit) | Operating Margin: ~2-3% | CEO Comp (Eugene Woods): publicly disclosed in Form 990 This issue's mechanism: The 2022 merger of Advocate Aurora Health and Atrium Health created Advocate Health, the largest nonprofit hospital merger of the decade, spanning 67 hospitals across six states and combining two already-large cross-market systems. Advocate Aurora was itself a 2018 merger. The Atrium addition brought hospitals in North Carolina, Georgia, and Alabama into a system whose original footprint was in the Midwest. Each layer of consolidation extended the system's geographic reach without reducing any local market's need for an inpatient hospital, creating leverage at every contract table the system sits at without offering a competitive alternative for payers to use. The aggregate commercial-rate effect across Advocate Health's markets is one of the largest line items in our per-market savings table.
Who Profits: UnitedHealth Group / Optum (UNH) FY2024 Revenue: $400.3B | Operating Margin: ~8.4% | CEO Comp (Andrew Witty): $26.3M | Stock Buybacks (2020-24): ~$25B | Lobbying (2020-24): ~$65M This issue's mechanism: UnitedHealth's Optum Health division employs approximately 90,000 physicians, making it the largest single physician employer in the US. Arnold and Fulton, writing in Health Affairs in November 2025, found that UnitedHealthcare pays Optum-owned physician practices 17 percent more than competing insurers pay similar non-Optum practices, with the differential rising to 61 percent in markets where UnitedHealthcare holds 25 percent or more market share. This is a payment-rate finding: UHC's own subsidiary receives a payment premium from UHC's own insurance arm, relative to what non-affiliated insurers pay non-affiliated physicians. That internal routing inflates the apparent cost basis that the insurer then passes into premiums, while the margin accrues within the same corporate umbrella. UnitedHealth has been profiled in Issue #4: The Middlemen, Issue #8: The Denial Machine, and Issue #11: The MA Overpayment; this issue profiles the horizontal-consolidation and vertical-integration mechanisms together.
Who Profits: Tenet Healthcare (THC) FY2024 Revenue: $20.6B | Operating Margin: ~10% | CEO Comp (Saum Sutaria): ~$15M | Stock Buybacks (2020-24): ~$2B | Lobbying (2020-24): ~$8M This issue's mechanism: Tenet's 49-hospital footprint is concentrated in Texas, Florida, and California. Tenet's Detroit-area consolidation across 2016 through 2021 is a documented case of the horizontal-merger-into-pricing-power sequence: acquisitions in the same metropolitan area that reduced the number of competing inpatient facilities and strengthened Tenet's position at commercial contract renegotiations. Tenet is smaller than HCA but its regional concentration strategy is the most direct expression of the mechanism: fewer hospitals in the market means higher rates at the next cycle.
Sources: HCA Healthcare FY2024 Form 10-K and DEF 14A proxy; UnitedHealth Group FY2024 Form 10-K and DEF 14A proxy; Tenet Healthcare FY2024 Form 10-K and DEF 14A proxy (all SEC EDGAR); CommonSpirit Health Form 990 (most recent IRS filing); Advocate Health Form 990 (most recent IRS filing); EMMA municipal-bond filing database (emma.msrb.org); Arnold D, Fulton BD, "UnitedHealthcare Pays Optum Providers More Than Non-Optum Providers," Health Affairs 44(11):1395-1403 (Nov 2025), DOI 10.1377/hlthaff.2025.00155; news records from the 2022 Advocate Aurora / Atrium merger regulatory review process; OpenSecrets.org federal lobbying disclosure database (2020-2024).
The Fix
The antitrust framework needed to address hospital consolidation already exists. The problem is not the law; it is the application of the law to healthcare markets, where the FTC and DOJ have historically been more permissive than in other industries and where state-level enforcement capacity varies widely. Three steps would close the gap.
Step 1: Enforce the existing merger-review framework on cross-market healthcare acquisitions. The Hart-Scott-Rodino (HSR) notification thresholds and the 2023 revised Horizontal Merger Guidelines already apply to hospital mergers. The specific gap is cross-market mergers: when a hospital system acquires a hospital in an adjacent commuting zone where it does not currently compete, the local HHI in either market may not cross the conventional threshold even though the merged entity gains leverage across the combined footprint. Fulton and coauthors' 2022 commuting-zone framework, which the FTC has incorporated into its review practice, addresses this directly. The proposal is to apply it consistently and to lower the HSR notification threshold for healthcare transactions, which are currently reviewed under the same dollar-threshold rules as any other industry.
Step 2: Fund and empower state antitrust enforcement. State attorneys general have antitrust authority and have used it: Pennsylvania with UPMC, Massachusetts with Partners HealthCare. They have not used it uniformly because state AG healthcare antitrust units are chronically underfunded. A dedicated federal grant program to state AG healthcare antitrust offices, modeled on the DOJ's state-assistance structure in other industries, would extend the review capacity to the regional and local mergers that fall below federal HSR thresholds. Private antitrust enforcement by self-insured employers is already permitted under Sherman Act Section 4 but almost never deployed; regulatory clarity that employer-plan fiduciaries have antitrust standing to challenge hospital mergers affecting their plan costs would add a private-enforcement layer.
Step 3: Rural exception fast-track, and unwind or divest remedies for completed mergers. Rural-rescue acquisitions that meet three defined criteria (closure-imminence test, sole-community-provider test, and a forward-looking price commitment) should receive expedited FTC review on a separate track from the mainstream merger review calendar. This carve-out insulates legitimate rural rescue from the policy's broader application. For already-completed mergers that have demonstrably raised prices in the post-merger period, the standard antitrust remedy is divestiture or behavioral remedy. The FTC's Evanston case established that precedent in healthcare; it has rarely been applied since. Reinstating the divestiture presumption for post-hoc anticompetitive findings would create a deterrent that prospective review alone does not.
The structure is: tighten the front door, fund the side doors, and fix what is already through.
What's Next
Issue #13: The Nonprofit Lie. Publishing May 24, 2026.
Sixty-seven percent of US hospitals operate as tax-exempt nonprofits. That status carries a promise: the hospital will deliver community benefit, principally charity care, in exchange for its federal and state tax exemption. When CommonSpirit's 2019 formation or Advocate Aurora's 2018 merger uses that nonprofit status to fund cross-market acquisitions that raise commercial rates, the question the tax code has never answered is this: at what point does the community benefit delivered stop justifying the tax exemption received? Issue #13 measures the gap between the two, hospital by hospital, from public Healthcare Cost Report Information System (HCRIS) and IRS Form 990 data.
Every script is on GitHub. Every number can be verified. If you think we got something wrong, open an issue: github.com/rexrodeo/american-healthcare-conundrum
If you found value in this work, forward it to someone who should see it.
[Subscribe to The American Healthcare Conundrum]
Sources: Cooper Z, Craig SV, Gaynor M, Van Reenen J. "The Price Ain't Right? Hospital Prices and Health Spending on the Privately Insured." Quarterly Journal of Economics 134(1):51-107 (Feb 2019). DOI: 10.1093/qje/qjy020. NBER WP 21815. https://www.ncbi.nlm.nih.gov/pmc/articles/PMC7517591/; Dafny LS, Ho K, Lee RS. "The Price Effects of Cross-Market Mergers: Theory and Evidence from the Hospital Industry." RAND Journal of Economics 50(2):286-325 (Summer 2019). DOI: 10.1111/1756-2171.12270. NBER WP 22106; Brot-Goldberg Z, Cooper Z, Craig SV, Klarnet LR, Lurie I, Miller CL. "Who Pays for Rising Health Care Prices? Evidence from Hospital Mergers." NBER Working Paper 32613 (June 2024; revised Feb 2026). https://www.nber.org/papers/w32613; FTC Staff Working Paper 307 (Evanston Northwestern retrospective). "Retrospective Analysis of the Clinical Quality Effects of the Acquisition of Highland Park Hospital by Evanston Northwestern Healthcare." https://www.ftc.gov/sites/default/files/documents/reports/retrospective-analysis-clinical-quality-effects-acquisition-highland-park-hospital-evanston/wp307.pdf; Beaulieu ND, Dafny LS, Landon BE, Dalton JB, Kuye I, McWilliams JM. "Changes in Quality of Care after Hospital Mergers and Acquisitions." New England Journal of Medicine 382:51-59 (Jan 2, 2020). DOI: 10.1056/NEJMsa1901383. PMID: 31893515. https://pmc.ncbi.nlm.nih.gov/articles/PMC7080214/; Fulton BD, Arnold DR, King JS, Montague AD, Greaney TL, Scheffler RM. "The Rise of Cross-Market Hospital Systems and Their Market Power in the US." Health Affairs 41(11):1652-1660 (Nov 2022). DOI: 10.1377/hlthaff.2022.00337. PMID: 36343312; Arnold D, Fulton BD. "UnitedHealthcare Pays Optum Providers More Than Non-Optum Providers." Health Affairs 44(11):1395-1403 (Nov 2025). DOI: 10.1377/hlthaff.2025.00155; Dafny LS, Duggan M, Ramanarayanan S. "Paying a Premium on Your Premium? Consolidation in the US Health Insurance Industry." American Economic Review 102(2):1161-1185 (April 2012). DOI: 10.1257/aer.102.2.1161. NBER WP 15434; AMA. "Competition in Health Insurance: A Comprehensive Study of US Markets, 2024 Report." American Medical Association, 2024. https://www.ama-assn.org/system/files/competition-health-insurance-us-markets.pdf; AMA. "2024 AMA Physician Practice Benchmark Survey." American Medical Association, 2024. https://www.ama-assn.org/system/files/2024-prp-pp-characteristics.pdf; Lewis MS, Schmitt AT. "New evidence on the impacts of cross-market hospital mergers on commercial prices and measures of quality." Health Services Research (2024). PMC: https://pmc.ncbi.nlm.nih.gov/articles/PMC11782062/; CMS. Provider of Services (POS) File, Hospital and Non-Hospital Facilities. Annual snapshots 2018-2025. https://data.cms.gov/provider-characteristics/hospitals-and-other-facilities/provider-of-services-file-hospital-non-hospital-facilities; CMS. HCRIS HOSP10 FY2023 Cost Reports. Worksheets G-3 and S-2. https://www.cms.gov/data-research/statistics-trends-and-reports/cost-reports/hospital-2010-form; CMS. National Health Expenditure Data 2024 (final). Private insurance hospital expenditure anchor. https://www.cms.gov/data-research/statistics-trends-and-reports/national-health-expenditure-data; Dartmouth Atlas. ZIP-to-HSA-to-HRR Crosswalk (2019 release). 3,436 HSAs, 306 HRRs. https://atlasdata.dartmouth.edu/static/supp_research_data; DOJ and FTC. "Merger Guidelines" (2023 revision). https://www.justice.gov/atr/merger-guidelines; HCA Healthcare FY2024 Form 10-K and DEF 14A proxy, SEC EDGAR; UnitedHealth Group FY2024 Form 10-K and DEF 14A proxy, SEC EDGAR; Tenet Healthcare FY2024 Form 10-K and DEF 14A proxy, SEC EDGAR; CommonSpirit Health Form 990 (most recent IRS filing); Advocate Health Form 990 (most recent IRS filing); EMMA municipal-bond filing database, emma.msrb.org; OpenSecrets.org federal lobbying disclosure database (2020-2024).
Cumulative savings identified: $483.8 billion per year. That's 14.9% of the $3.24 trillion gap between US and Japan per-capita healthcare spending.
- Issue #12 booked: $13B (net of $3.5B overlap with Issue #3 and $0.9B set aside for an upcoming issue, Issue #15; gross $17.4B).
- Market-definition sensitivity: $13B at the Hospital Service Area level (3,436 areas nationally), $16B at the larger Hospital Referral Region level (306 regions nationally). Project range: $13B to $30B, with the upper bound dependent on commercial-claims access for direct coefficient re-estimation on the post-2019 cohort.
- Coefficient stack from the published literature: Cooper 2019 QJE (15.3% monopoly-market differential); Dafny/Ho/Lee 2019 RAND J Econ (7-9% cross-market); FTC Evanston Working Paper 307 (11.1-17.9 percentage points post-merger increase); Brot-Goldberg/Cooper/Craig/Klarnet/Lurie/Miller 2024 NBER WP 32613. We apply these coefficients piecewise based on the post-merger concentration level in each market.
- Merger panel: 1,155 ownership-change events 2018-2025 from CMS Provider of Services annual snapshots; 530 classified as horizontal consolidation; 315 unique merger Hospital Service Areas; 178 unique merger Hospital Referral Regions.
- Commercial spend denominator: NHE 2024 private insurance hospital spend ~$595B; merger-market allocation roughly $218 billion. Uniform 40% commercial-share allocation reconciled to the NHE national anchor.
- Cross-validation against the four anchor papers: Cooper applied to the monopoly subset by construction (15.3%); Dafny on the cross-market subset (8.0%); FTC Evanston within the published 11.1-17.9pp range; Brot-Goldberg at 13.26% versus the 9% national central, reflecting that 70.5% of merger HSAs in our panel ended at near-monopoly concentration post-merger.
- Bed-count market-share proxy from POS file. Verified system-affiliation flags from the AHA Annual Survey Database would refine the proxy; that data is the recommended partnership ask.
- Prior cumulative after Issue #11 (published May 10, 2026): $470.8B. Issue #12 adds $13B. New cumulative: $483.8B / $3.24T = 14.9%.
- Denominator: $3.24 trillion US-Japan per-capita spending gap (US per-capita $15,474, Japan $5,790, US population ~336 million; CMS NHE 2024 final, Organisation for Economic Co-operation and Development Health at a Glance 2025).
The American Healthcare Conundrum publishes when the data is ready. All analysis uses publicly available data. Code is open-source. Figures are validated before publication.
Get every issue in your inbox
The American Healthcare Conundrum is free. One fixable problem in U.S. healthcare, with the data, every week.