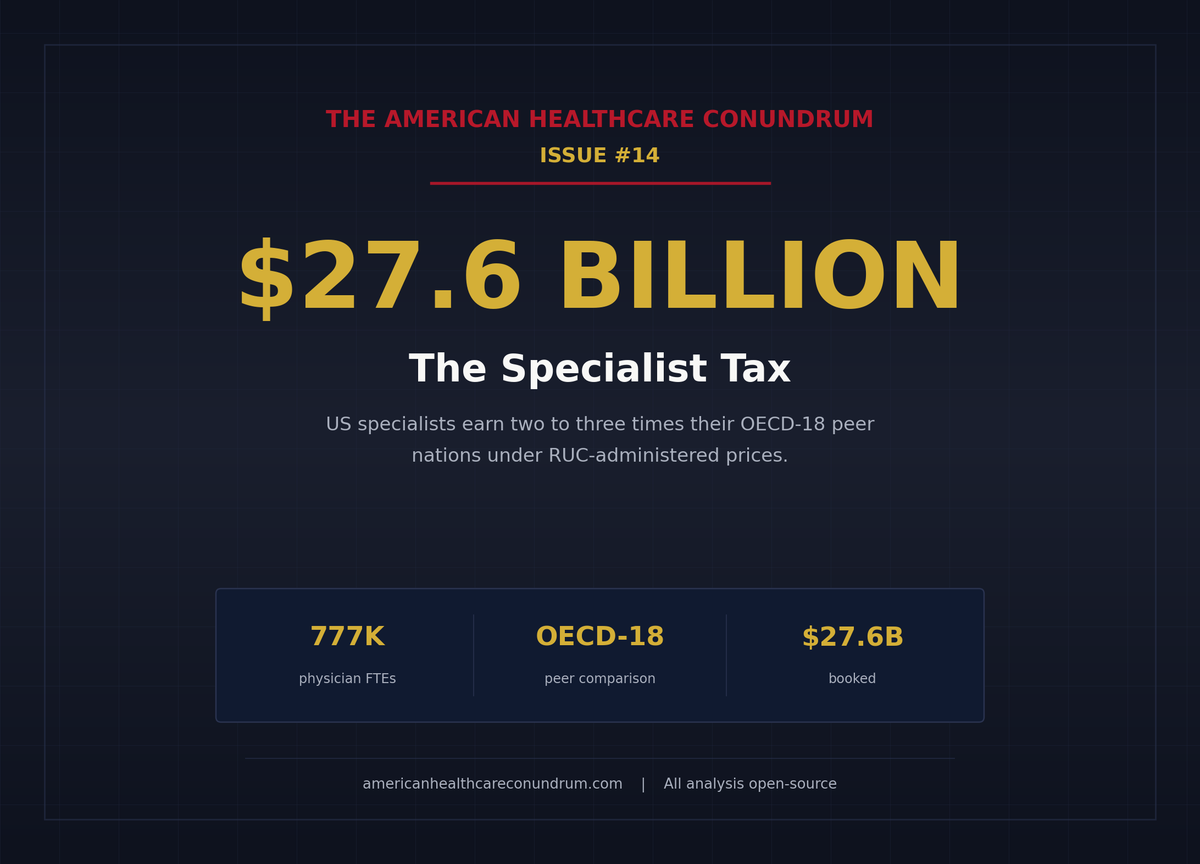
Issue #14: The Specialist Tax
How a 30-year-old payment cascade overpays procedural specialty work relative to primary care and international peers, generating $28 billion per year in recoverable excess
Each issue of The American Healthcare Conundrum identifies one fixable problem in U.S. healthcare spending, builds the data case, and recommends a specific policy fix. All analysis uses publicly available data. Code is open-source.
Target: ~$3.24T US-Japan per-capita spending gap
(Japan: highest life expectancy, lowest infant
 mortality in OECD, ~half US per-capita spend)

Full scale: $0 ─────────────────────────── $3.24T
            █████░░░░░░░░░░░░░░░░░░░░░░░  16.0%
            ↑ $516.8B identified

Per-issue savings (1 block ≈ $8B; max bar = $200B):
 #1 ▏                          $0.6B   OTC Drug Overspending
 #2 ███                       $25.0B   Drug Pricing
 #3 █████████                 $73.0B   Hospital Pricing
 #4 ████                      $30.0B   PBM Reform
 #5 █████████████████████████ $200.0B  Admin Waste
 #6 ███                       $28.0B   Supply Waste
 #7 █████                     $40.0B   GLP-1 Pricing
 #8 ████                      $32.0B   Denial Machine
 #9 █                          $6.6B   Employer Trap
#10 █                          $7.6B   Procedure Mill
#11 ████                      $28.0B   MA Overpayment
#12 ██                        $13.0B   Consolidation Tax
#13 █                          $5.4B   Nonprofit Lie
#14 ███                       $27.6B   Specialist Tax (this issue)
   ──────────────────────────────────────────────────
   Total: $516.8B  ·  $2,723.2B remaining
   Scale: $3.24T (CMS NHE 2024; Japan OECD 2023)
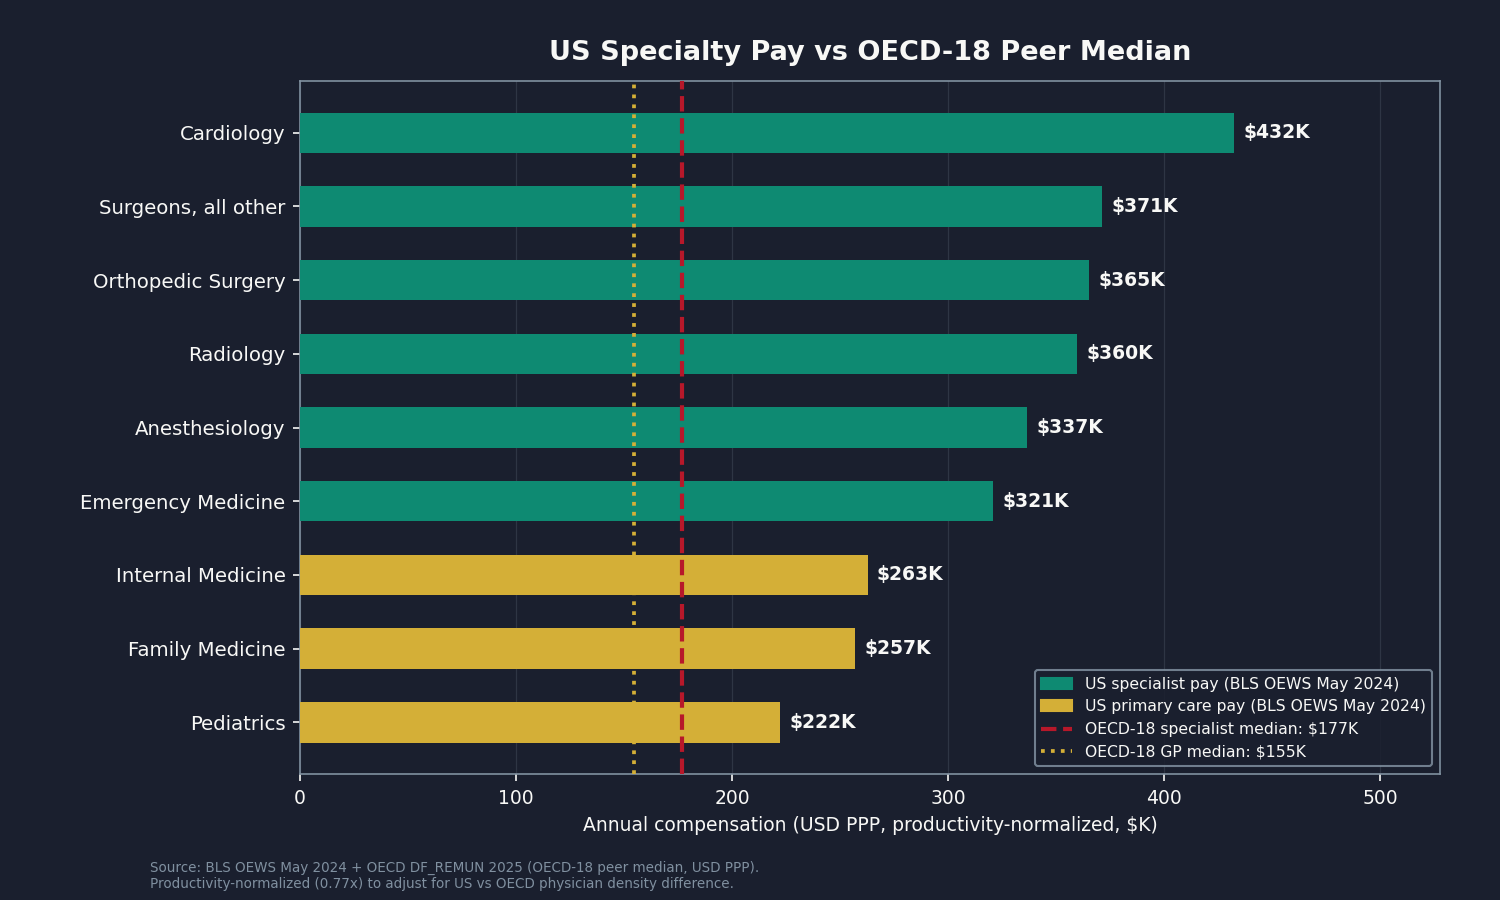
A family doctor in Pittsburgh and an orthopedic surgeon working at the same hospital network see roughly the same number of patients each week. The family doctor earns about $260,000 per year. The orthopedic surgeon earns about $560,000. (Doximity 2025 specialty medians; BLS Occupational Employment and Wage Statistics May 2024, codes 29-1062 and 29-1242.)
Neither one set those numbers. The Centers for Medicare and Medicaid Services (CMS) Physician Fee Schedule did, guided by a committee called the Specialty Society Relative Value Scale Update Committee (RUC), which recommends the relative payment values that CMS converts into Medicare rates.
US physicians earn more than physicians in any other Organisation for Economic Co-operation and Development (OECD) country. But the gap between what the US pays specialists and what peer nations pay specialists is not the product of a free labor market. It is the product of an administered price cascade: the RUC recommends values, CMS adopts roughly 87 percent of those recommendations unchanged, commercial insurers benchmark their own physician rates as multiples of Medicare, and employers pay premiums that reflect those commercial rates. The market for physician payment is downstream of the payment architecture, not upstream of it.
Closing the gap would save the system roughly $28 billion per year.
That is the conservative estimate, derived entirely from public data, using a defensible peer comparison of 18 high-income OECD countries. If private compensation databases confirmed the Bureau of Labor Statistics (BLS) wage anchor as a floor rather than a ceiling, the recoverable range extends to $35 billion at aggressive assumptions.
The fix is not "pay doctors less." Physicians made enormous personal sacrifices to get here. Eleven to fifteen years of post-college training. Median medical-school debt above $200,000, per the Association of American Medical Colleges (AAMC). Residency weeks that run sixty to eighty hours at hourly rates that would shock anyone who did the division. Malpractice exposure that runs higher in dollar terms than in any OECD peer nation. An administrative burden that steals from every clinical hour, documented in Issue #5: The Paper Chase, and a prior authorization machine that makes practice increasingly exhausting, documented in Issue #8: The Denial Machine.
The fix targets the payment system that converts good clinical training into a debt-driven specialty allocation. That is a different target than the people in the exam room.
How a Committee Nobody Has Heard Of Sets Your Doctor's Pay
Every procedure and visit that a physician bills to Medicare carries a payment determined by three numbers multiplied together: a Relative Value Unit (RVU), a geographic adjustment, and a conversion factor (CF).
The RVU is supposed to capture the work, the overhead, and the malpractice exposure required to deliver a service. Each year, CMS publishes a Physician Fee Schedule (PFS) that specifies the RVU for every billing code in the Healthcare Common Procedure Coding System (HCPCS).
The problem is that CMS does not derive those RVU values independently. It relies on the RUC.
The RUC is a committee convened by the American Medical Association (AMA). It has 31 voting members appointed by specialty societies. It meets three times a year in closed session. When a physician service needs a payment value, the relevant specialty society surveys its own members about how difficult the service is, and those survey results go to the RUC. The RUC's recommendations then go to CMS.
CMS adopted approximately 87 percent of RUC work-value recommendations unchanged between 1994 and 2010, per the analysis by Laugesen, Wada, and Chen in Health Affairs. The Medicare Payment Advisory Commission (MedPAC) has criticized this arrangement annually since at least 2009. The Government Accountability Office (GAO) documented the staff-capacity problem in GAO-15-434 in 2015: CMS does not have the independent infrastructure to evaluate the RUC's recommendations at scale.
The result is what Bodenheimer, Berenson, and Rudolf identified in the Annals of Internal Medicine in 2007 and what MedPAC confirmed again in its June 2025 Report: evaluation-and-management (E&M) codes, the office visits that constitute most of primary care, are systematically undervalued. Procedural codes, the interventions that dominate cardiology, orthopedic surgery, gastroenterology, and ophthalmology, are systematically overvalued. The RUC composition reflects this: procedural specialties hold more seats than their share of clinical encounters would suggest.
When a 45-minute orthopedic procedure can pay three to four times what a 45-minute primary-care visit pays, for roughly the same physician time, the income math is not subtle. The Resource-Based Relative Value Scale (RBRVS), which was designed in 1992 to narrow exactly this gap, has not delivered that result.
The Cascade From Medicare to Your Employer
The RVU story does not stay inside Medicare. It reaches commercial insurance, and from there it reaches your employer's premium.
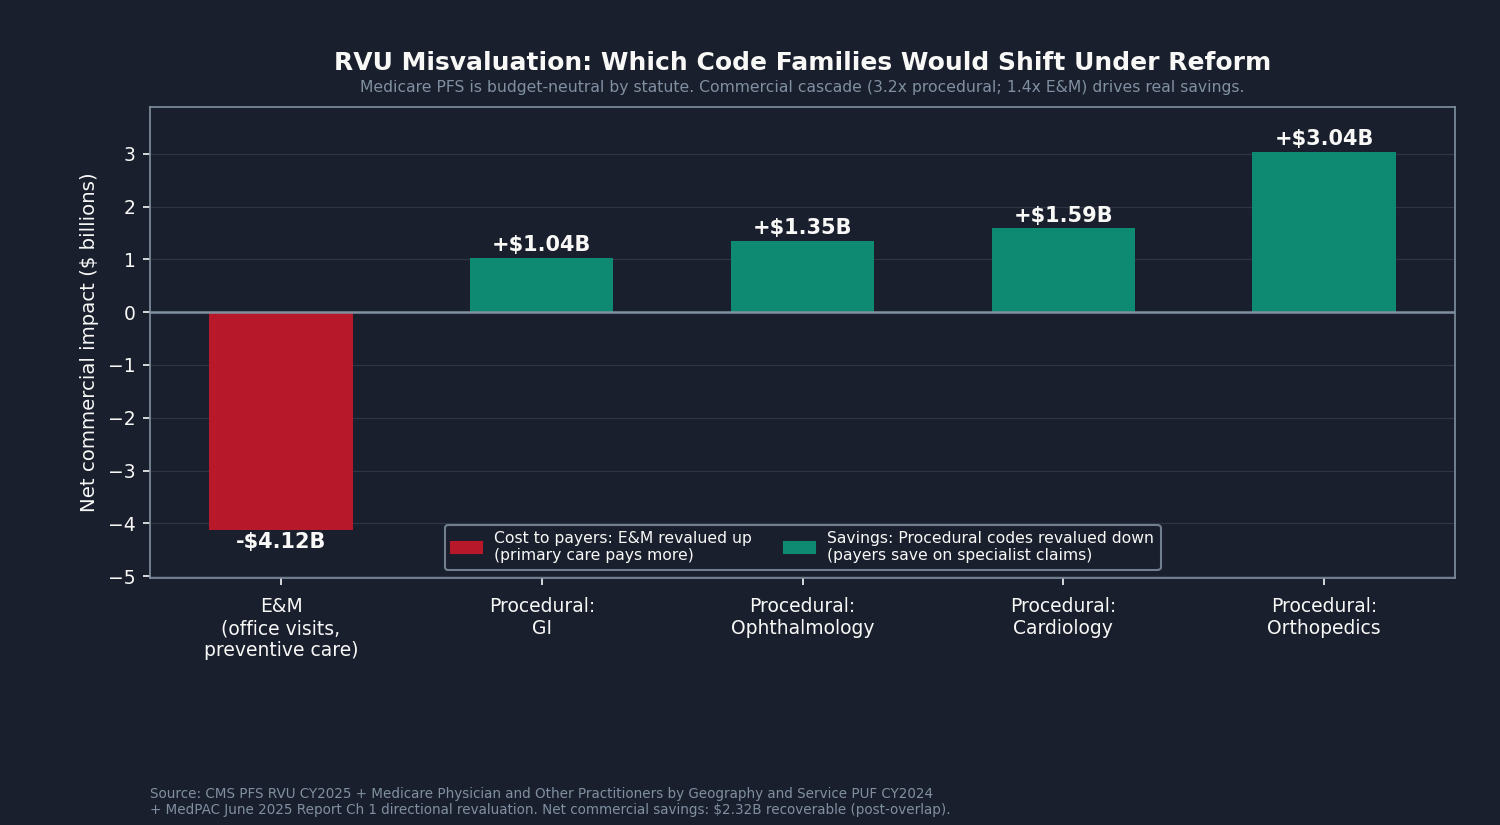
Commercial insurers negotiate physician rates as multiples of Medicare PFS. The multiplier for procedural codes runs roughly 2.8 to 3.5 times Medicare, per the Pelech 2023 MedPAC Brief and the KFF Peterson Health System Tracker data. The multiplier for E&M codes runs roughly 1.4 times Medicare. These are not contractual requirements pegged to Medicare; they are the observed outcome of how commercial insurer-provider contracts are structured and renewed.
That gap between the two multipliers, 3.2 for procedures and 1.4 for office visits, is what makes the reform work. Here is why.
By law, Medicare cannot spend any more or less in total when it re-rates services (Social Security Act Section 1848(c)(2)(B)). If it raises the value of office visits, it has to turn down a master dial, the conversion factor, to keep total spending flat. So rebalancing the schedule to pay office visits fairly and procedures less generously saves Medicare itself nothing. The dial cancels it out.
Commercial insurers have no such rule. They simply take whatever value Medicare assigns to a service and multiply it. Because they mark procedures up 3.2 times but office visits only 1.4 times, lowering the procedure values cuts commercial prices sharply, while raising the office-visit values adds back only a little. The two moves do not cancel. Commercial spending falls.
So the savings from fixing the RVU schedule do not show up inside Medicare. They show up in the commercial market, which is where most of the specialist pay premium is paid in the first place.
Insurers might object that this saving never reaches anyone. Their argument: because commercial rates are negotiated, not legally tied to Medicare, an insurer could keep its own prices right where they are even after Medicare rebalances, and pocket the difference as profit. It is a fair objection, so it is worth answering directly.
Three things make that outcome unlikely.
The first is history. When Medicare turned its master dial down by 2.83 percent in 2025 (the conversion factor fell from $33.29 to $32.35, per the CMS-1807-F Final Rule), commercial physician prices did not climb to fill the gap. If insurers reliably captured Medicare's changes as extra profit, that is exactly what we would have seen, and we did not.
The second is the contracts. Insurer-provider contracts re-peg to the current year's Medicare schedule every year. So when Medicare's values shift, commercial prices follow within a year or two rather than drifting away permanently.
The third is a legal floor on insurer profit. Under the Affordable Care Act, an insurer has to spend at least 80 cents of every premium dollar on actual care (85 cents in the large-employer market) or refund the difference to customers. That rule, called the medical loss ratio (MLR), means an insurer cannot quietly bank a pricing windfall. Past the threshold, the money goes back to policyholders.
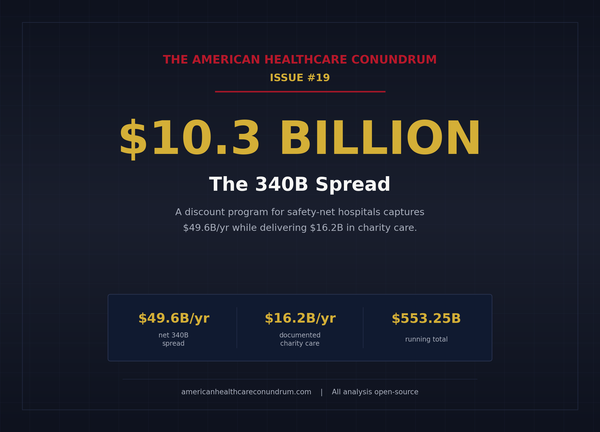
Taken together, the commercial saving is real, not a number insurers can intercept. We book this piece (Component C) conservatively at $2.3 billion a year. It is the smallest of the four components, but the cleanest: one rule change, well within authority CMS already has.
The International Picture: $28 Billion at Constant Productivity
Our per-specialty analysis joins four data sources: the CMS PFS Relative Value File CY2025, the Medicare Physician and Other Practitioners by Geography and Service public use file (PUF) for service year 2024, the BLS Occupational Employment and Wage Statistics (OEWS) May 2024 physician occupational series, and the OECD Health at a Glance 2025 Indicator 8.6 (Remuneration of Doctors) underlying dataset in purchasing power parity (PPP) USD.
The OECD dataset compiles country-by-country specialist and general practitioner compensation. The peer comparison uses 18 high-income OECD countries: Australia, Austria, Belgium, Canada, Switzerland, Germany, Denmark, Finland, France, the United Kingdom, Ireland, Iceland, Italy, the Netherlands, Norway, New Zealand, Sweden, and South Korea. This is the standard high-income peer group used in international health systems research. It excludes lower-income OECD members (Mexico, Costa Rica, Colombia, Turkey, Chile) and post-Soviet Eastern European states (Bulgaria, Poland, Slovakia, Czech Republic, Hungary, Estonia, Latvia, Lithuania, Croatia, Slovenia) whose physician compensation reflects different cost structures and training environments. Japan would be included in this peer set but does not currently report physician remuneration to the OECD database. The US does not currently submit physician remuneration data to the OECD's DF_REMUN dataset, so we anchor the US side on the BLS OEWS observed wage statistic rather than an OECD-format US submission. This is the most conservative public-data path available.
The full-time-equivalent (FTE) counts come from the BLS 29-1xxx occupation series and are mapped to the OECD specialist or general practitioner category for each specialty.
One normalization is necessary before comparing. The US has 2.7 physicians per 1,000 population; the OECD average is 3.5. Fewer physicians per capita means each US physician sees more patients per full year than the OECD average. We discount the raw compensation gap by approximately 23 percent (factor: 2.7/3.5 = 0.77) to account for this productivity difference. This makes our estimate conservative: if the productivity factor were closer to 0.85, reflecting the fact that administrative burden offsets some throughput advantage, Component A would be larger, not smaller.
After applying the peer-group restriction and this normalization factor, the OECD-18 specialist median is $176,673 per year in PPP-USD, and the OECD-18 general practitioner (GP) median is $154,664. (The full-OECD pooled median is $148,562 for specialists, roughly 16 percent lower, because it includes lower-income members.) The US specialist average (BLS anchor) runs roughly $253,000 to $432,000 per year depending on specialty. The productivity-normalized gap, aggregated nationally across full-time-equivalent physician counts, is $64.2 billion annually.
At a 55 percent recoverability factor (accounting for the decade-scale pace of workforce and payment reform), Component A contributes $35.3 billion to the recoverable sum.
The largest named-specialty contributors to the raw gap include Cardiology, Anesthesiology, Radiology, General and Vascular Surgery, Orthopedic Surgery, Family Medicine, and Internal Medicine. Family Medicine and Internal Medicine are compared against the OECD-18 general practitioner (GP) median of $154,664; all procedural specialties are compared against the OECD-18 specialist median of $176,673. The orthopedic surgery US-to-OECD-18 multiple is approximately 2.46 times, reflecting a gap that has slightly widened since Laugesen and Glied documented 2.2 times using 2008 data.
The "Physicians, all other" BLS bucket (29-1228 and 29-1248 codes) spans 315,360 full-time-equivalent positions and is the single largest line in the Component A analysis. This is also the most uncertain line: the BLS bucket pools high-paid sub-specialties (interventional cardiology, hematology-oncology, transplant surgery) with mid-paid sub-specialties and cannot be decomposed further without matching to the AAMC National Provider Identifier registry taxonomy. We map it to the OECD-18 specialist median, which is the most defensible public-data path. Because 41 percent of all physician FTEs sit inside this heterogeneous aggregate, the methodology footnotes address this limitation directly.
A second important caveat: BLS OEWS captures employed clinicians. Practice-owner net income, which includes net profit from the practice business, is not captured by BLS. The Doximity 2025 and Medscape 2025 physician compensation reports, both of which include self-employed respondents, run 10 to 25 percent higher than BLS A_MEAN for procedural specialties. This means Component A is conservative on the US side: the true gap is likely larger than what the $64.2 billion raw figure shows, not smaller.
The cross-validation against the Laugesen/Glied 2011 Health Affairs landmark paper holds. Laugesen and Glied found US orthopedic surgeons earned approximately 2.2 times their peers in a six-country OECD comparison using 2008 data; the updated computation against the OECD-18 peer group produces 2.46 times. The gap has not closed in the intervening fifteen years.
The Workforce Mix: Why the Ratio Matters
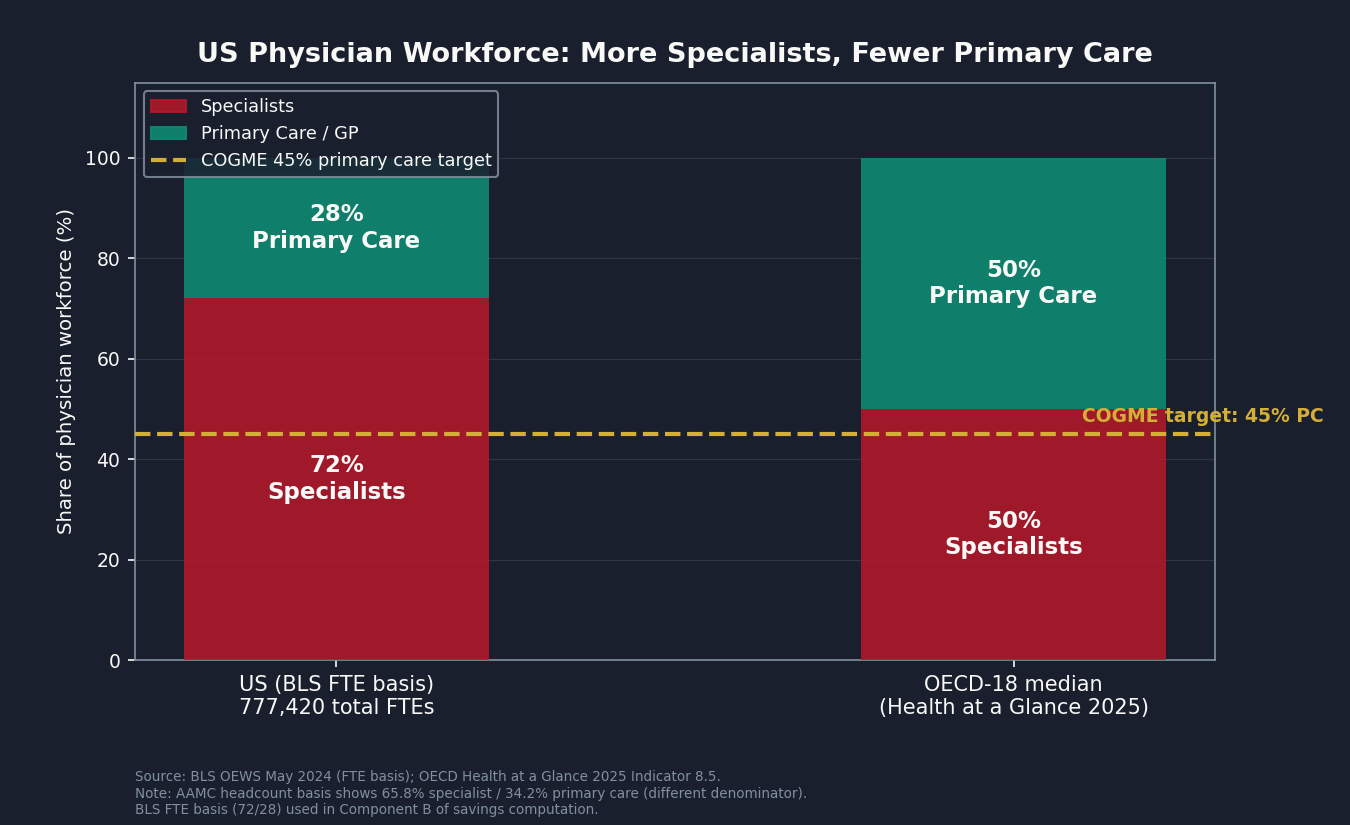
Component B is a thought experiment. What if the US had the same specialty-to-primary-care workforce ratio as the OECD median, while paying each physician exactly what the US pays today?
AAMC headcount data shows approximately 65.8 percent specialist and 34.2 percent primary care across the active US physician workforce. The BLS-FTE basis used in the workforce-mix counterfactual (Component B) is approximately 72 percent specialist and 28 percent primary care, because BLS captures employed-FTE clinical practice rather than total active physician count, tilting further toward specialty by excluding trainees and part-time clinicians. The OECD median is approximately 50/50. The Council on Graduate Medical Education (COGME) has recommended a 40 to 45 percent primary-care target for three decades, with no enforcement mechanism behind the recommendation.
Component B reallocates the BLS-FTE 28 percent primary-care share toward the COGME target of 45 percent. If the national mix shifted to the COGME 45 percent target at constant US per-FTE compensation, total US physician spending would fall by $4.7 billion annually in the steady state, because primary-care physicians earn less than specialty physicians at current payment rates. At the 55 percent recoverability factor, Component B contributes $2.6 billion.
This is a modest number. The significance of Component B is not the dollar contribution; it is the structural story it tells. The primary-care-to-specialist ratio in the US is not an accident. It is the downstream output of the RVU schedule, the GME formula, and the medical-education debt structure. When the payment system makes specialty practice pay back student loans three times faster than primary care, the match-day behavior of indebted medical graduates is rational, not pathological.
The GME Formula: Training for the Wrong Future
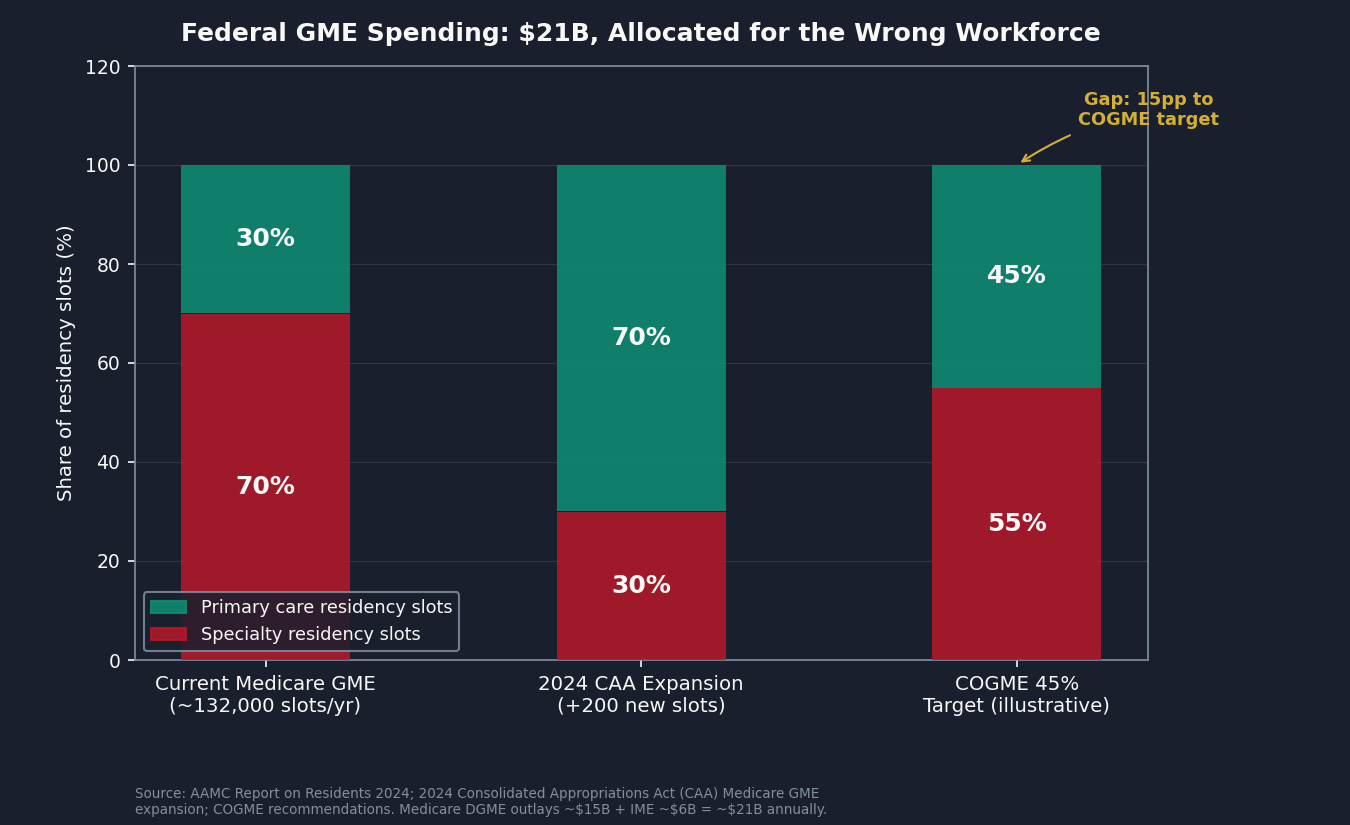
Component D asks a narrower question. The federal government spends approximately $10 billion per year on Medicare-funded Graduate Medical Education (GME): roughly $3 billion in Direct Graduate Medical Education (DGME) payments and roughly $7 billion in Indirect Medical Education (IME) payments. When Medicaid GME, Veterans Affairs GME, and Health Resources and Services Administration (HRSA) Title VII Health Professions training are included, total federal GME outlay reaches roughly $15 to $21 billion annually.
DGME and IME payments flow to teaching hospitals based on Medicare inpatient volume and resident-to-bed ratios. Neither formula targets specialty allocation. Neither formula is designed to match the workforce composition that the COGME and the AAMC's own workforce projections suggest the US actually needs.
The AAMC's March 2024 Physician Workforce Projections estimate a US physician shortage of up to 86,000 by 2036. Of that, the primary-care shortage is projected at 20,200 to 40,400 physicians. The surgical specialty shortage is projected at 10,100 to 19,900. The primary-care side of the projected shortage is comparable to or larger than the specialty side.
Congress has demonstrated that the GME formula can be reweighted. The 2024 Consolidated Appropriations Act reauthorization allocated approximately 70 percent of newly authorized Medicare-supported residency positions to primary care and psychiatry programs. That is the direction COGME has recommended since the 1990s. What has been missing is scale and continuity.
Component D models the downstream physician-spending implication of reallocating the residency pipeline toward the COGME 45 percent primary-care target over a ten-year horizon. The per-FTE compensation delta between specialty and primary care (approximately $35,700 per FTE at current rates) applied to the 132,000 FTE shift required to reach the COGME target, amortized at 50 percent for the residency-throughput lag, produces a $2.4 billion raw annual saving. At a 60 percent recoverability factor, Component D contributes $1.4 billion.
The Full Accounting: Four Components, $28 Billion
Here is how the four components sum to the booked figure:
- Component A. International comp gap (productivity-normalized, OECD-18 peers): $64.2B raw, $35.3B recoverable. Levers: international benchmarking, medical-education debt reform, independent revaluation.
- Component B. Workforce-mix counterfactual: $4.7B raw, $2.6B recoverable. Levers: GME slot reallocation, primary-care payment uplift.
- Component C. RVU misvaluation residual (commercial cascade): $2.9B raw, $2.3B recoverable. Levers: RUC reform, CMS independent revaluation unit.
- Component D. GME allocation counterfactual: $2.4B raw, $1.4B recoverable. Lever: federal GME formula reweighting to the COGME 45 percent target.
Pre-overlap recoverable sum: $41.6 billion.
From the $41.6 billion recoverable sum, four overlap subtractions apply against prior issues in the series:
- Issue #3: The 254% Problem (hospital labor flow-through): 15 percent of the pre-overlap recoverable sum = $6.2 billion. When commercial rates are capped at 200 percent of Medicare under the reference-pricing fix in Issue #3, physician compensation as a labor input absorbs some of that compression. We do not count that portion twice.
- Issue #10: The Procedure Mill (physician-labor share of low-value volume): 20 percent of Issue #10's booked $7.6 billion = $1.5 billion. If low-value procedures are no longer performed, the physician compensation from those procedures is Issue #10's, not Issue #14's.
- Issue #11: The MA Overpayment (Medicare Advantage coding-intensity flow-through): 5 percent of the pre-overlap recoverable sum = $2.1 billion. Chart reviews that generate additional Medicare Advantage (MA) coding revenue land primarily on the insurer income statement; we subtract the small physician-billing share.
- Issue #12: The Consolidation Tax (employed-specialist comp flow-through): 10 percent of the pre-overlap recoverable sum = $4.2 billion. Consolidation-driven pricing power in employed-specialist networks contributes to the raw Component A gap; Issue #12 owns that layer.
Total overlap subtractions: $14.0 billion. Net booked figure: $41.6B minus $14.0B = $27.6 billion, rounded to $28 billion.
The overlap subtractions are at or above the conventions used in prior issues (Issue #12 subtracted 21 percent, Issue #13 subtracted 15 percent). We would rather under-attribute to Issue #14 than introduce double-counting into the cumulative tracker.
What We Can and Cannot Say
Three caveats belong in the body, not just the methodology footnotes.
First, BLS OEWS does not capture practice-owner net income. Self-employed physicians who own their practices report higher compensation in Doximity and Medscape surveys than the BLS A_MEAN for most specialties. This means Component A's $64.2 billion raw figure is conservative on the US side: the true gap is more likely to be larger than we compute, not smaller.
Second, the "Physicians, all other" BLS category is a 315,000-FTE catch-all. It is the largest single line in the Component A analysis and the hardest to calibrate precisely. We map it to the OECD-18 specialist median, which is the most defensible public-data path, but applying a uniform specialist median to a heterogeneous bucket that includes gastroenterologists, oncologists, and physiatrists understates the variation. The analysis acknowledges this directly, and sub-specialty decomposition using the AAMC National Provider Identifier taxonomy would sharpen it. Per the methodology footnotes, we do not visualize this bucket as a named specialty.
Third, the productivity normalization factor of 0.77 is a density-based assumption, not a visits-per-physician number. US physician-to-population density (2.7 per 1,000) versus the OECD average (3.5) implies US physicians carry a proportionally heavier per-FTE patient load. But administrative burden, documented in Issue #5: The Paper Chase, offsets some of that throughput advantage, and the per-visit data suggest the true ratio is closer to 0.85. Using 0.77 is the more conservative choice: a 0.85 factor would widen the raw gap by roughly 10 percent. We use 0.77 because it understates rather than overstates the headline.
The Counter-Arguments, Taken Seriously
The most legitimate counter to this analysis is also the most common: US physicians earn more because they owe more, endure more, and risk more than their international peers.
On debt: the AAMC Medical School Graduation Questionnaire puts median medical-school debt at above $200,000. OECD peer nations fund medical education publicly; graduates enter practice carrying little or no educational debt. This is a real structural difference, not a rhetorical footnote. The fix accounts for this explicitly: medical-education debt reform is the first sub-lever, not the last.
On training: eleven to fifteen years of post-college education and residency training is real and demanding. This is not comparable to peer professions in the US; it is comparable to peer physicians in other countries, who complete similar training timelines. The international comparison is between physicians and physicians, not between physicians and teachers.
On malpractice: US malpractice premiums are higher in dollar terms than peer nations. They have not, however, grown as fast as the compensation gap in the past decade. And US malpractice exposure is itself a product of a US-specific legal framework; it is a structural input, not a natural constraint.
On administrative burden: the prior authorization machine, the billing complexity, the documentation requirements cataloged in Issues #5 and #8 are real costs imposed on physicians by a system they did not design. The right fix for administrative burden is to eliminate that burden through the reforms in Issues #5 and #8. It is not to preserve compensation above international benchmarks as a compensating differential for an administrative apparatus that should not exist.
The second major counter is that reducing specialty compensation would create specialist shortages. The AAMC's own 2024 Physician Workforce Projections project a primary-care shortage of 20,200 to 40,400 by 2036 and a surgical specialty shortage of 10,100 to 19,900. The primary-care side of the projected shortage is comparable to or larger than the specialty side. The fix expands primary-care training. It does not contract specialty training. No proposed intervention here reduces any existing physician's compensation.
The "free labor market" defense deserves a direct answer. US physician compensation is not set by a free labor market; it is set by the administered cascade described at the outset, where the RUC recommends, CMS adopts, commercial insurers benchmark, and employers pay. A resident choosing cardiology over family medicine is responding rationally to the RVU schedule, the GME incentive structure, and a $200,000 student loan balance. Reforming the RUC is not wage compression; it is reforming the rate-setting process.
The Fix: Five Levers, No Pay Cuts
The fix for the Specialist Tax operates through five structural levers. None of them proposes reducing any existing physician's income.
Lever 1: CMS independent revaluation unit. MedPAC's June 2025 Report recommends that Congress direct the Secretary to collect and use timely cost data for relative-value revaluation, independent of RUC recommendations. MedPAC plays this independent role for hospital payment; there is no architectural reason CMS cannot do the same for physician payment. The precedent for independent rate-setting bodies exists at the state level in Maryland and Vermont. The 2025 Senate Finance Committee physician payment reform draft included a CMS independent revaluation provision. This is the most tractable single reform because it requires legislation but not a multi-decade workforce shift.
Lever 2: GME slot reallocation. The 2024 Consolidated Appropriations Act reauthorization demonstrated that Congress can and will direct new Medicare-supported residency positions toward primary care and psychiatry. Continuing and scaling that allocation principle across the next decade of GME slot decisions would progressively shift the resident pipeline toward the workforce composition that the AAMC workforce projections say the country needs. This is not a fast lever, but it is a proven one.
Lever 3: Relative-value shift toward E&M in the PFS annual cycle. CMS issues a PFS Final Rule each November. MedPAC's June 2025 recommendations provide a direction: shift relative weights toward E&M codes, applying budget neutrality via the conversion factor. The Medicare savings are zero by statute; the commercial-cascade savings are where the $2.3 billion in Component C accrues. This lever is within CMS's authority under existing statute.
Lever 4: Medical-education debt restructuring. If specialty choice is partly a debt-payback calculation, the most direct structural fix is to reduce the debt that drives it. Federal loan forgiveness for primary-care service (an expansion of existing programs like the National Health Service Corps and the Public Service Loan Forgiveness pathway), public medical-school expansion to drive tuition down, and per-specialty loan-repayment formulas that make primary care financially competitive with specialty debt-service profiles. This lever addresses the constraint that physicians face, not the payment level. Getting the constraint right is the precondition for a different workforce composition.
Lever 5: Scope-of-practice expansion (upcoming Issue #29). An upcoming issue will quantify the savings from allowing nurse practitioners and physician assistants to practice to the full extent of their clinical training in primary-care settings. Expanded scope of practice is not a substitute for more primary-care physicians; it is a complement that increases access in underserved settings, takes pressure off the primary-care shortage, and lets physicians practice at the top of their training. Issue #14 explicitly carves out the substitution component for that future analysis; the workforce-mix counterfactual here is physician-only.
Authority for these is split. Congress has to act on Levers 1, 2, and 4: the independent revaluation unit, the GME reallocation, and the debt restructuring all require legislation. CMS can move on Lever 3, the shift toward E&M, on its own under existing rulemaking authority. States control Lever 5, scope-of-practice expansion (upcoming Issue #29). And the employers who self-insure under ERISA (Issue #9) have the clearest private incentive to push for Lever 3, because they are the ones paying the inflated commercial prices that overvalued procedure codes produce.
Who Profits
This issue's beneficiaries are not a clean list of price-gouging executives. The entities that profit most from the specialist-heavy, RVU-driven payment system are hospital networks that generate revenue through employed-specialist procedure volume, ambulatory surgery operators built around high-RVU procedural codes, and the institutional body that licenses and maintains the code system the entire cascade runs on. The following profiles document those institutional mechanisms. They do not profile individual physicians.
HCA Healthcare (HCA) FY2024 Revenue: $70.6B | Operating Margin: ~13% | CEO Comp (Sam Hazen): ~$24M | Stock Buybacks (2020-24): ~$14B | Lobbying (2020-24): ~$28M This issue's mechanism: HCA employs and affiliates with approximately 50,000 physicians, with heavy concentration in procedural specialties: cardiology, orthopedics, gastroenterology, and oncology. The commercial rates HCA hospitals and physician groups bill for those specialty procedures run approximately 3.2 times Medicare for procedural codes. When CMS PFS unit values are high for procedures, the entire commercial-rate cascade amplifies that premium. HCA's revenue per surgical case tracks the procedural RVU values its affiliated specialists generate. HCA was profiled on hospital pricing in Issue #3: The 254% Problem and on consolidation in Issue #12: The Consolidation Tax; the mechanism here is the upstream RVU valuation that sets the rate HCA's specialists bill before the commercial multiplier is applied.
Sources: HCA Healthcare FY2024 Form 10-K and DEF 14A proxy via SEC EDGAR; OpenSecrets.org federal lobbying disclosure database (2020-2024).
UnitedHealth Group / Optum Health (UNH) FY2024 Revenue: $400.3B | Operating Margin: ~8.4% | CEO Comp (Andrew Witty): $26.3M | Stock Buybacks (2020-24): ~$25B | Lobbying (2020-24): ~$65M This issue's mechanism: Optum Health employed approximately 90,000 physicians across its care delivery segment as of 2024. UnitedHealth profits on both sides of the specialist-pay structure: as an insurer, it sets commercial rates that incorporate the Medicare PFS multiplier for procedures; as an employer of physicians, it captures the productivity generated by those specialty rates inside Optum's own care-delivery network. The vertical integration means UnitedHealth's insurer arm and its physician-employment arm both benefit from high procedural RVU values. The commercial multiplier UHC negotiates with its own Optum physicians is not publicly disclosed. UnitedHealth was profiled on prior authorization in Issue #8: The Denial Machine and on Medicare Advantage coding intensity in Issue #11: The MA Overpayment and on consolidation in Issue #12: The Consolidation Tax.
Sources: UnitedHealth Group FY2024 Form 10-K and DEF 14A proxy via SEC EDGAR; Optum Health segment financial disclosures; OpenSecrets.org federal lobbying disclosure database (2020-2024).
Tenet Healthcare / United Surgical Partners International (THC / USPI) FY2024 Revenue: $20.7B | USPI Segment Adjusted EBITDA Margin: ~40% (~$1.81B USPI adjusted EBITDA) | CEO Comp (Saum Sutaria): ~$15M | Stock Buybacks (2020-24): ~$2B | Lobbying (2020-24): ~$8M This issue's mechanism: USPI, Tenet's ambulatory surgery center division, operates a procedure-heavy portfolio across orthopedics, gastroenterology, ophthalmology, and musculoskeletal specialties. Employed-physician compensation in ambulatory surgery center (ASC) arrangements often includes procedure-revenue sharing; when procedural RVU values are high, the ASC captures additional revenue per case and shares it with the participating physician. USPI's segment margin is substantially higher than typical hospital segment margins, in part because ASC billing is anchored to the same high-RVU procedure codes that the RUC has consistently protected from downward revaluation.
Sources: Tenet Healthcare FY2024 Form 10-K and DEF 14A proxy via SEC EDGAR; USPI segment financial disclosures via Tenet 10-K.
DaVita (DVA) FY2024 Revenue: $12.8B | Operating Margin: ~16% | CEO Comp (Javier Rodriguez): ~$13.1M This issue's mechanism: DaVita employs and contracts with a large nephrology physician workforce. Nephrology is a specialty whose compensation is partly captured at the corporate level through fee-for-service Medicare bundled-payment economics on dialysis services. The per-session facility and physician fee revenue that flows through DaVita's treatment centers reflects the Medicare PFS valuation of nephrology-adjacent codes. DaVita's scale in dialysis (more than 2,600 outpatient centers) gives it pricing power in the physician-employment market that amplifies the specialty premium.
Sources: DaVita FY2024 Form 10-K and DEF 14A proxy via SEC EDGAR.
American Medical Association (AMA) (private 501(c)(6) trade association) FY2023 Total Revenue: ~$468M (Form 990) | CPT Licensing Royalties: ~$284M (Form 990 FY2023 royalties line) | Executive Director Comp (James Madara): ~$2.8M (FY2022 Form 990 Schedule J; FY2023 pending IRS publication) This issue's mechanism: The AMA convenes the RUC and owns the Current Procedural Terminology (CPT) code system. Every time a physician bills a CPT code to any payer in the United States, the AMA receives a licensing royalty. The CPT code system underpins the HCPCS Level I codes that drive the entire RVU calculation. AMA has a financial interest in CPT usage volume and a governance role in the RUC process that shapes how those codes are valued. The combination creates an institutional arrangement where the body that profits from billing-code volume also controls the advisory process that sets the relative values of those codes. AMA is not publicly traded; its financial disclosures are available only through Form 990.
Sources: AMA Form 990 FY2023 via IRS Tax Exempt Organization Search (apps.irs.gov); AMA-assn.org RUC landing page; Laugesen 2016 ("Fixing Medical Prices," Harvard University Press).
The Unbooked Range
The booked $28 billion is the public-data estimate at central recoverability assumptions. The derivable range runs from $20 billion (conservative recoverability) to $35 billion (aggressive recoverability). Going beyond $35 billion would require private data that we do not have:
- MGMA Physician Compensation Survey full microdata ($1,500-$3,000 license): production-adjusted compensation by specialty and region, replacing the BLS OEWS floor with a production-adjusted number that captures practice-owner income.
- AHA Annual Survey physician-employment flag: hospital-employed versus independent physician composition for Component A, allowing us to separate the employment-model share of the gap from the independent-practice share.
- Sullivan Cotter executive compensation database: hospital-employed physician compensation at the system level.
- IRS Form 990 Schedule J non-cash compensation: nonprofit hospital employer-side data for the physician compensation line.
- US submission to OECD DF_REMUN: the most structurally important gap. The US does not currently submit physician remuneration data to the OECD in their standard format, which means every US-vs-OECD physician compensation comparison uses a BLS anchor on the US side and an OECD-format figure on the international side. An apples-to-apples comparison would require the US to submit. OECD has invited the submission for years.
If you work with any of these datasets or have a data use agreement that includes matched physician compensation and clinical productivity data, we would like to hear from you. We will run the analysis, publish the results, and share the methodology: contact@ahcdata.fund / ahcdata.fund.
Methodology and Limitations
Six analytical choices that bear on the headline are worth making explicit.
Peer comparison group. The international comparison uses the OECD-18 high-income peer group (Australia, Austria, Belgium, Canada, Switzerland, Germany, Denmark, Finland, France, the United Kingdom, Ireland, Iceland, Italy, the Netherlands, Norway, New Zealand, Sweden, and South Korea), excluding lower-income OECD members where a like-for-like physician compensation comparison would not be meaningful. The full-OECD median is roughly 16 percent lower; using the broader set would inflate the apparent gap by approximately $9 billion and would include countries (Bulgaria, Mexico, Costa Rica, Colombia) that are not plausible benchmarks for the US physician market.
Workforce basis reconciliation. Specialist-to-primary-care shares are reported on two bases that are not interchangeable. Headcount data from the Association of American Medical Colleges (AAMC) shows 65.8 percent specialist and 34.2 percent primary care among active US physicians. The full-time-equivalent (FTE) basis used in the Bureau of Labor Statistics (BLS) Occupational Employment and Wage Statistics, which is the denominator the workforce-mix counterfactual (Component B) uses, is 72 percent specialist and 28 percent primary care because BLS captures clinical-practice FTE rather than total active physician count, and excludes trainees and part-time clinicians. The two are not interchangeable; per-FTE savings computed on a headcount basis would mix populations.
Component C is directional. The Component C estimate ($2.3 billion recoverable) is directional rather than precise, within an approximate plus or minus $3 billion noise floor. The mechanism (commercial payers pricing off Medicare RVUs at a 3.2 times cascade for procedures and 1.4 times for evaluation-and-management codes) is well-documented, but the magnitude depends on whether commercial payers pass a RVU rebalancing through to lower procedure prices or retain the unit-value shift as margin. The body discusses both scenarios.
BLS compensation excludes practice owners. The US physician compensation anchor in Component A is the BLS Occupational Employment and Wage Statistics mean annual wage, which captures employed clinicians only and excludes self-employed practice-owner net income. Doximity and Medscape compensation surveys, which capture total compensation including practice ownership, report figures 10 to 25 percent higher than BLS for most specialties. The analysis applies a productivity normalization factor to the gap that partially offsets this, but the BLS anchor remains conservative: the published headline is more likely to understate the structural gap than to overstate it.
Productivity normalization is density-based. Component A applies a 0.77 productivity normalization factor to reflect that the US has fewer practicing physicians per 1,000 population than the OECD-18 average (2.7 versus 3.5), implying US physicians see proportionally more patients per FTE. This is a density-based proxy. A visits-per-FTE computation from OECD Health at a Glance consultation data yields a ratio of approximately 0.86; an hours-based computation (US physicians average 52 hours per week versus OECD approximately 45) yields a ratio above 1.0. The 0.77 density factor is conservative in the direction of understating the gap. Switching to 0.85 would widen Component A raw by approximately 10 percent.
"Physicians, all other" bucket is heterogeneous. The BLS "Physicians, all other" occupational classification (approximately 315,000 FTE, 41 percent of the BLS physician workforce) pools sub-specialty categories that BLS does not separately report: Gastroenterology, Hematology-Oncology, Endocrinology, Pulmonary Medicine, Nephrology, Rheumatology, and others. The analysis applies the OECD-18 specialist median uniformly to this bucket. Per-sub-specialty resolution would require licensed Medical Group Management Association (MGMA) microdata, which is an explicit data-partner request in the Closing the Data Gap section.
What's Next
Issue #15: The Facility Fee Scam. Publishing June 7, 2026.
The same procedure performed by the same physician costs Medicare two to four times more when billed in a hospital outpatient department (HOPD) than in an independent physician office. The differential is the facility fee, a billing code that exists because CMS treats the hospital as a separate cost center even when it is the same building, the same equipment, and the same staff. Issue #15 quantifies the site-of-service differential across the most-billed HCPCS codes, identifies which codes are eligible for site-neutral payment under existing or proposed CMS rules, and books the recoverable share net of overlap with Issue #12 consolidation and Issue #14 specialist payment.
Issue #14's analysis deliberately carved out the facility-fee component for Issue #15. The Component C RVU misvaluation residual here operates on work-RVU values, which are constant across billing settings. The practice-expense-RVU differential between HOPD and office settings belongs to Issue #15.
All analysis for this issue is available at github.com/rexrodeo/american-healthcare-conundrum. The scripts, the per-specialty output table, and the overlap accounting matrix are there for anyone who wants to check the math or challenge the methodology. If you find an error, we want to know. If you have better data, we want that too.
If this issue changed how you think about who sets your doctor's pay, forward it to one person who should read it.
Sources: Laugesen/Glied 2011 (Health Affairs 30(9):1647-1656, DOI 10.1377/hlthaff.2010.0204); Laugesen/Wada/Chen 2012 (Health Affairs, PMC5590651); Bodenheimer/Berenson/Rudolf 2007 (Annals of Internal Medicine 146(4):301-306, DOI 10.7326/0003-4819-146-4-200702200-00011); Wiltshire et al. 2020 (JAMA Network Open, DOI 10.1001/jamanetworkopen.2020.7427, PMID 32721025); MedPAC June 2025 Report Chapter 1 (medpac.gov/wp-content/uploads/2025/06/Jun25_Ch1_MedPAC_Report_To_Congress_SEC.pdf); GAO-15-434 May 2015 (gao.gov/products/gao-15-434); Laugesen 2016 "Fixing Medical Prices" (Harvard University Press, ISBN 978-0-674-54516-8); OECD Health at a Glance 2025 Indicator 8.6: Remuneration of Doctors (oecd.org); BLS Occupational Employment and Wage Statistics May 2024, 29-1xxx series (bls.gov/oes); AAMC Physician Workforce Projections 2024 (aamc.org/data-reports/workforce); AAMC Report on Residents 2024 Table B3 (aamc.org); AAMC U.S. Physician Workforce Data Dashboard 2024 (aamc.org); CMS Physician Fee Schedule Final Rule CY2025 (CMS-1807-F, cms.gov); CMS Medicare Physician and Other Practitioners by Geography and Service PUF CY2024 (data.cms.gov); CMS PFS Relative Value File CY2025 (RVU25D, cms.gov); Pelech 2023 MedPAC Brief on commercial physician payment rates (medpac.gov); Committee Representation and Medicare Reimbursements 2018 (PMC6232394); Eden et al. 2024 "Re-evaluation of the methodology for estimating the US specialty physician workforce" (PMC11034525); 2024 Consolidated Appropriations Act GME expansion (AAMC press release, aamc.org); Social Security Act Sec. 1848(c)(2)(B) (statutory budget neutrality for Medicare PFS).
Savings Tracker: $516.8 Billion and Counting
Cumulative savings identified: $516.8 billion per year. That is 16.0% of the $3.24 trillion gap between US and Japan per-capita healthcare spending.
Methodology notes:
- Prior cumulative after Issue #13 (published 2026-05-24): $489.2B / $3.24T = 15.1%.
- Issue #14 booked: $27.62B (range $19.65B-$35.49B, derived from conservative and aggressive recoverability bands). Computed from four components: Component A (international comp gap, productivity-normalized, OECD-18 high-income peer group) $35.3B recoverable from $64.2B raw; Component B (workforce-mix counterfactual, BLS-FTE 28% PC share canonical) $2.6B recoverable from $4.7B raw; Component C (RVU misvaluation residual, commercial cascade only, Medicare = $0 by statutory budget neutrality under SSA Sec. 1848(c)(2)(B)) $2.3B recoverable from $2.9B raw; Component D (GME allocation counterfactual) $1.4B recoverable from $2.4B raw. Pre-overlap recoverable sum: $41.6B. Overlap subtractions: Issue #3 hospital labor flow-through (15% of the pre-overlap recoverable sum) $6.2B; Issue #10 physician-labor share of procedure volume (20% of $7.6B booked) $1.5B; Issue #11 MA coding intensity physician-billing share (5% of the pre-overlap recoverable sum) $2.1B; Issue #12 consolidation employed-specialist flow-through (10% of the pre-overlap recoverable sum) $4.2B. Total overlap subtractions: $14.0B. Booked: $41.6B minus $14.0B = $27.6B, rounded to $28B in body prose and $27.6B in tracker.
- US wage anchor: BLS OEWS May 2024 A_MEAN for 29-1xxx physician occupation series. OECD anchor: OECD Health at a Glance 2025 Indicator 8.6 DF_REMUN dataset, USD_PPP, restricted to OECD-18 high-income peer group (AUS, AUT, BEL, CAN, CHE, DEU, DNK, FIN, FRA, GBR, IRL, ISL, ITA, NLD, NOR, NZL, SWE, KOR), aggregated as median-of-country-medians. The US does not currently submit to OECD DF_REMUN; US anchor is BLS OEWS, not OECD-format data. This is the most conservative public-data path.
- Productivity normalization factor: 0.7714 (US physician density 2.7 per 1,000 vs. OECD average 3.5 per 1,000). This is a density-based proxy, not a visits-per-FTE measurement; the empirical visits-per-FTE ratio is closer to 0.86, and hours-based productivity favors US physicians (52 hrs/wk vs OECD 45). The 0.77 density factor is the conservative choice; switching to 0.85 would widen the raw gap by approximately 10%.
- "Physicians, all other" BLS bucket (29-1228, 29-1248): 315,360 FTEs mapped to OECD-18 specialist median. Largest single line; sub-specialty decomposition requires AAMC NPI registry matching not feasible from public data alone. Not visualized as a named specialty in any chart.
- Recoverability factors: Component A 55%; Component B 55%; Component C 80%; Component D 60%. These are judgments about the political-economic horizon for structural reform over a ten-year period, not mathematical certainties. See results/recoverability_sensitivity.csv for conservative/central/aggressive bands.
- New cumulative: $489.2B + $27.62B = $516.82B / $3.24T = 16.0%.
- $3.24T denominator from CMS National Health Expenditure Accounts 2024 final data ($15,474 US per-capita) minus Japan OECD Health at a Glance 2025 ($5,790 Japan per-capita) multiplied by US population 336M. Applies to Issues #9 onward.
The American Healthcare Conundrum publishes when the data is ready. All analysis uses publicly available data. Code is open-source. Figures are validated before publication.
Get every issue in your inbox
The American Healthcare Conundrum is free. One fixable problem in U.S. healthcare, with the data, every week.