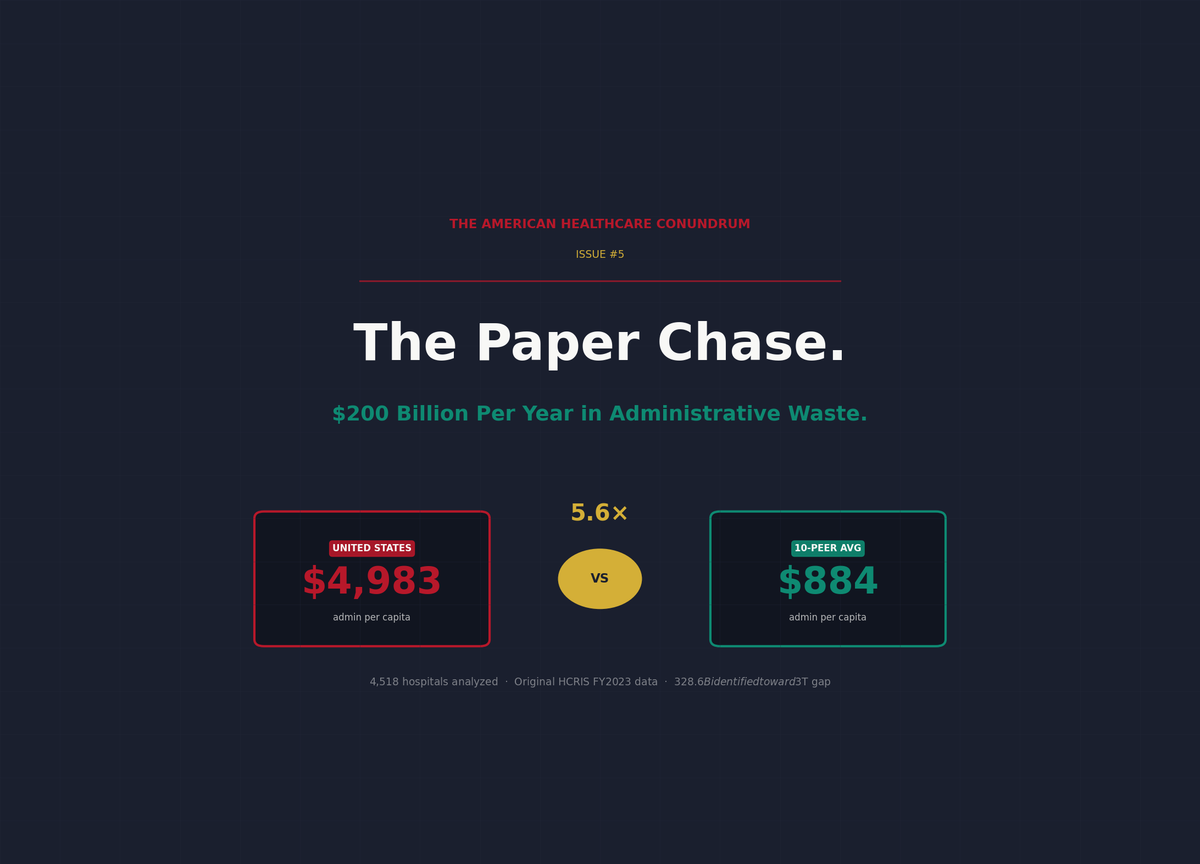
Issue #5: The Paper Chase
How $200 billion a year in billing complexity and administrative overhead inflates U.S. healthcare costs
The American Healthcare Conundrum is an investigative data journalism project. Each issue identifies one fixable problem in the US healthcare system, quantifies the waste, and recommends a specific solution. We publish the code. We publish the methodology. We publish the caveats. Anyone can check our work.
SAVINGS TRACKER
Target: ~$3T US-Japan per-capita gap
Japan: highest life expectancy, lowest
infant mortality in OECD, ~half US cost

Full scale: $0 ──────────────── $3T
            ████░░░░░░░░░░░░░  11.0%
            ↑ $328.6B identified

Zoomed (first $400B):
 #1  ░       $0.6B   OTC Drug Overspending
 #2  ████    +$25.0B  Drug Pricing
 #3  █████████████  +$73.0B  Hospitals
 #4  █████   +$30.0B  PBM Reform
 #5  ████████████████████████████████████████  +$200.0B  Admin Waste
     ─────────────────────────────────────────────
     Total: $328.6B · $2,671.4B remaining
On February 21, 2024, a ransomware group called ALPHV/BlackCat gained access to Change Healthcare's network using a single stolen login credential. The intrusion took minutes. The disruption that followed lasted weeks.
Change Healthcare processes approximately 15 billion US healthcare transactions a year, roughly one in every three medical claims filed in this country (American Hospital Association, 2024; Senate Finance Committee, May 2024). It handles eligibility verification, prescription routing, claims submission, prior authorization requests, and remittance processing for most of the country's hospitals, physician practices, and pharmacies (67,000 pharmacies; AHA). When the ransomware deployed, pharmacies could not verify insurance or process prescriptions. Hospitals lost the ability to submit claims. Small practices, which typically operate on 30-day cash reserves, began missing payroll within three weeks. The American Medical Association reported that 80% of physicians experienced financial harm from the outage. CMS deployed $2 billion in emergency advance payments to keep providers solvent while the system was down (CMS, 2024).
The attack cost Change Healthcare's parent company UnitedHealth Group, which had acquired Change Healthcare in 2022 for $13 billion, $872 million in the first quarter alone (UnitedHealth Group FY2024 10-K).
Here is what the outage revealed: the entire financial infrastructure of American healthcare runs through a handful of commercial pipes. One ransomware attack could paralyze a $4.9 trillion industry not because it targeted anything clinical (no hospital systems, no electronic medical records, no surgical equipment) but because it targeted the billing layer: the layer that exists to move money from payer to provider. That layer is, in measurable and documented terms, larger and more expensive in the United States than in any comparable country on earth.
The question the attack made visible is not primarily a cybersecurity question. It is: Why does this much infrastructure exist in the first place?
This issue is built on a dataset we assembled from raw federal cost reports. We downloaded the CMS Hospital Cost Report Information System (HCRIS) for fiscal year 2023, extracted every hospital's administrative and overhead spending line by line, and measured what administration actually costs at 4,518 US hospitals. The full dataset, 4,518 rows with 22 columns per hospital, is published in our open-source repository. Every number in this issue can be checked against it.
4,518 Hospitals. $141 Billion in Administration.
The CMS Hospital Cost Report Information System requires every Medicare-participating hospital to file a detailed cost report annually. Worksheet A of that report breaks hospital spending into specific cost centers: each department, each overhead function, each clinical service. Line 500, Column 700, is Administrative and General (A&G): the cost center that covers executive offices, finance departments, human resources, legal, compliance, and general administration.
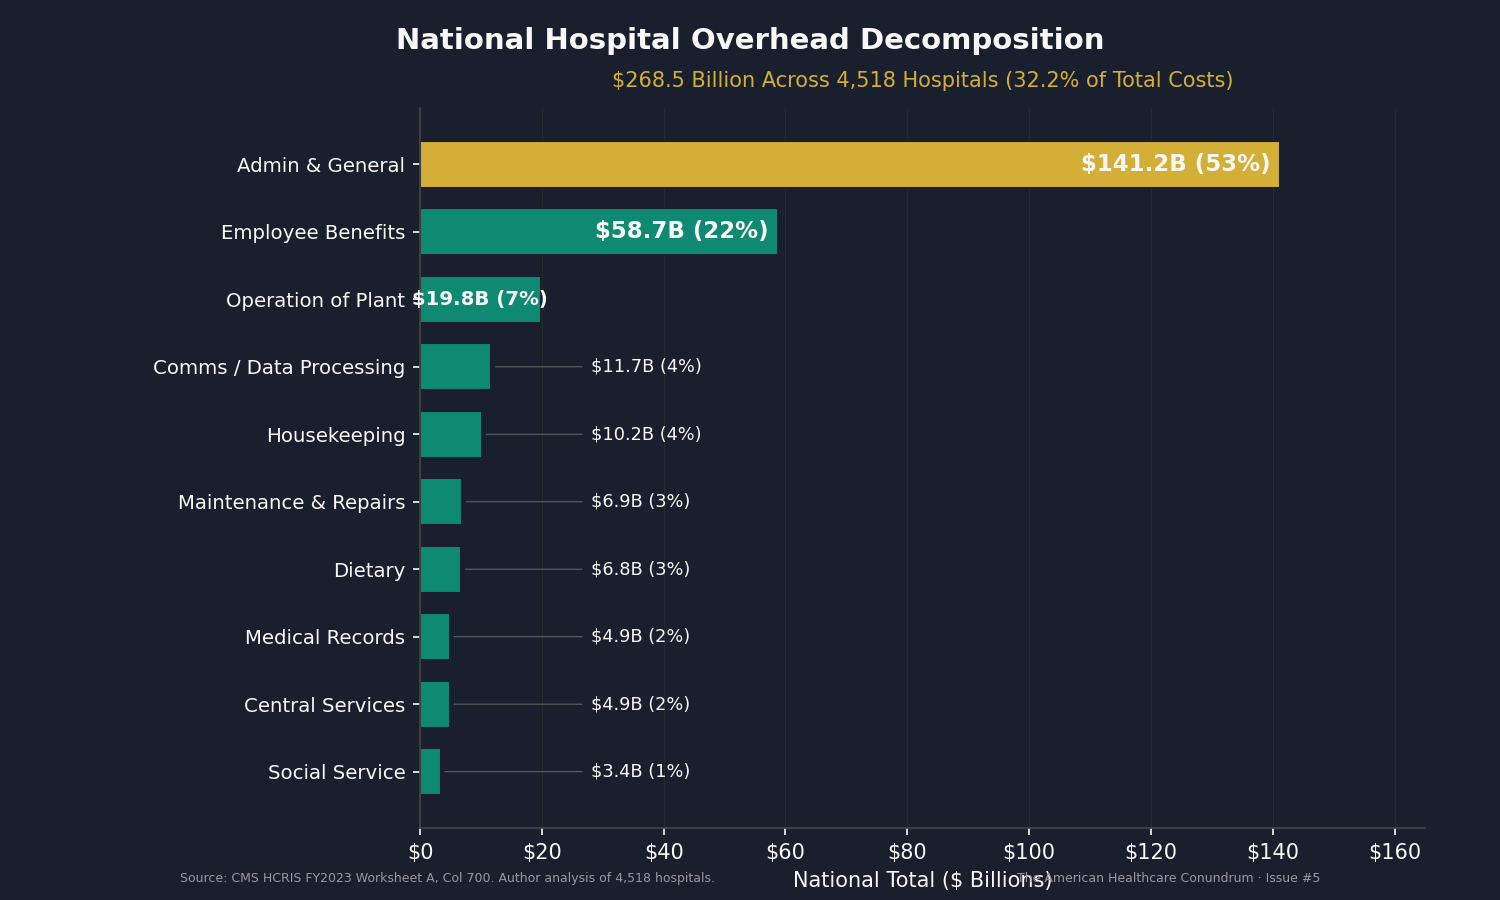
We extracted Line 500 for every hospital that reported at least 100 discharges and nonzero A&G costs in fiscal year 2023. The result: 4,518 hospitals, 112.3 million discharges, $141.2 billion in Administrative and General spending.
That is a single line on the cost report. Below it, additional overhead cost centers add up: employee benefits ($58.7 billion), operation of plant ($19.8 billion), communications and data processing ($11.7 billion), housekeeping ($10.2 billion), dietary ($6.8 billion), maintenance ($6.9 billion), medical records ($4.9 billion), central services ($4.9 billion), social service ($3.4 billion), and several smaller categories. The total overhead across all administrative and operational support lines: $268.5 billion, or 32.2% of total hospital costs.
That 32.2% figure deserves attention. In 2020, Woolhandler and Himmelstein published the most rigorous accounting of US healthcare administrative costs in the medical literature, finding that 34.2% of total national health expenditure went to administration (Annals of Internal Medicine, 2020). Their analysis covered the entire health system, not just hospitals, and used a different methodology (employment surveys, wage records, insurance filings). Our 32.2%, computed from a completely different data source (individual hospital cost reports filed with CMS), lands within two percentage points of their figure. Two independent approaches, two different data sources, the same conclusion: roughly a third of every dollar spent on healthcare in the United States goes to overhead.
The decomposition tells us where. Here is how the $268.5 billion breaks down:
| Cost Center | National Total | Median Per Discharge |
|---|---|---|
| Administrative & General | $141.2B | $1,438 |
| Employee Benefits (dept) | $58.7B | $494 |
| Operation of Plant | $19.8B | $235 |
| Communications / Data Processing | $11.7B | $124 |
| Housekeeping | $10.2B | $109 |
| Dietary | $6.8B | $72 |
| Maintenance & Repairs | $6.9B | $171 |
| Medical Records & Health Info | $4.9B | $49 |
| Central Services & Supply | $4.9B | $61 |
| Social Service | $3.4B | $42 |
| Total Overhead | $268.5B | $2,058 |
The A&G line alone, $141.2 billion, is larger than the entire revenue of all but four US corporations.
The Variance Is the Story
The national total matters. What matters more is the variance.
Across all 4,518 hospitals, the 75th percentile hospital spends 6.2 times the 25th percentile hospital per discharge on A&G. The 90th percentile spends 26.7 times the 10th percentile. These are hospitals operating under the same federal billing requirements, the same insurance landscape, the same coding standards.
The national distribution is wide enough that the extreme ratio is uninformative (it mixes 25-bed critical access hospitals with 800-bed academic medical centers). The meaningful question is: within a peer group of similar-sized hospitals treating patients of similar acuity, how much does administrative spending vary?
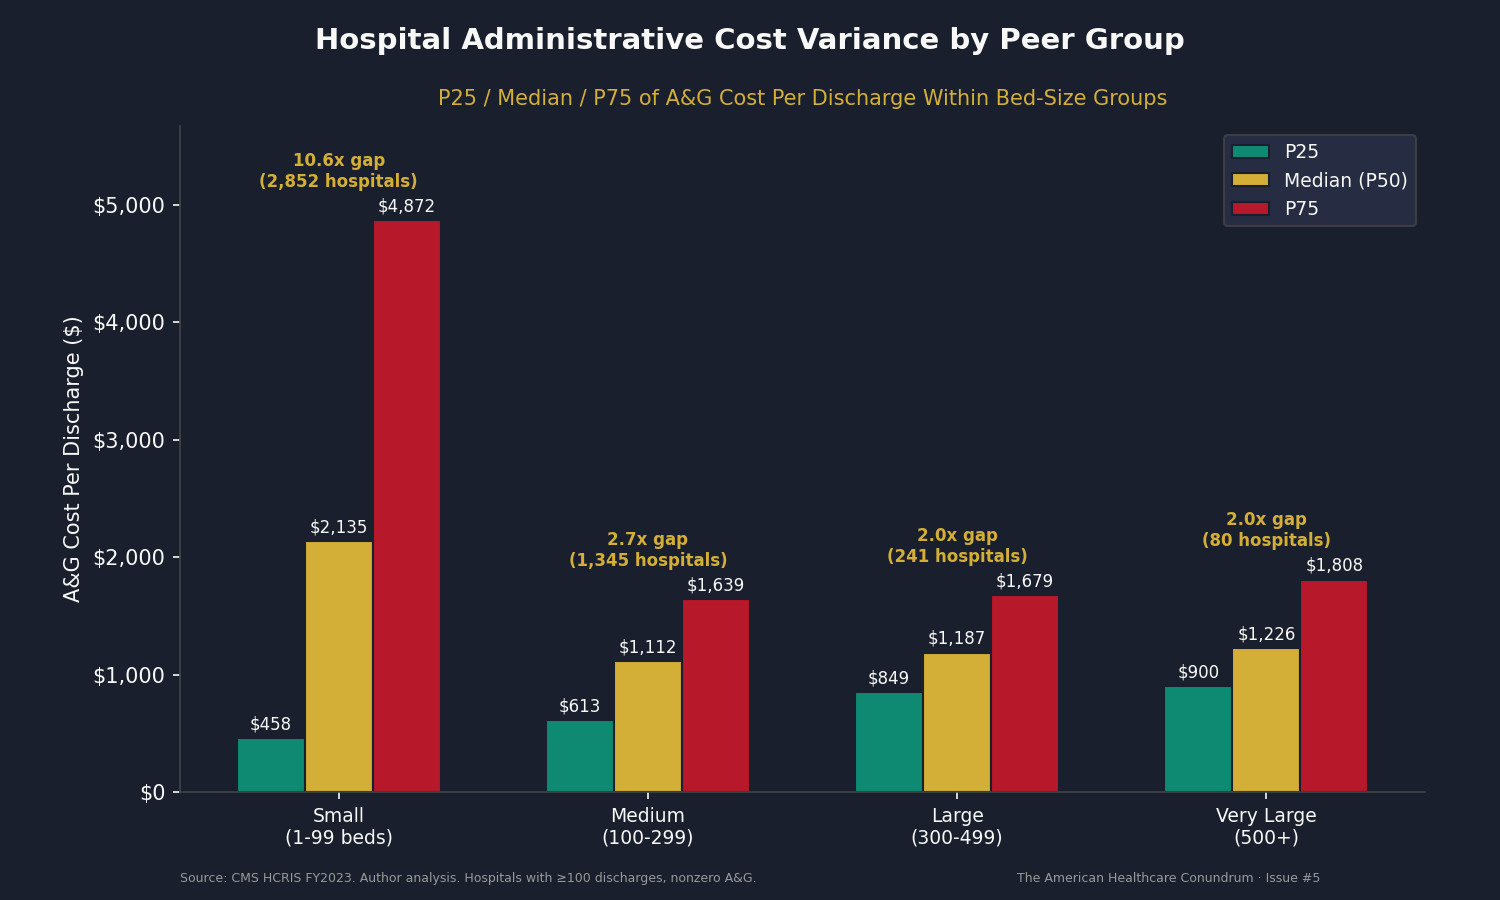
Within bed-size peer groups, controlling for hospital scale:
| Peer Group | P25 | Median | P75 | P75/P25 Ratio |
|---|---|---|---|---|
| Medium (100-299 beds), 1,345 hospitals | $613 | $1,112 | $1,639 | 2.7x |
| Large (300-499 beds), 241 hospitals | $849 | $1,187 | $1,679 | 2.0x |
| Very Large (500+ beds), 80 hospitals | $900 | $1,226 | $1,808 | 2.0x |
| Small (1-99 beds), 2,852 hospitals | $458 | $2,135 | $4,872 | 10.6x |
The small-hospital category includes both critical access hospitals (high fixed overhead spread across few discharges) and specialty surgical centers (high revenue per case, low admin per discharge). The extreme spread reflects this mix. For medium, large, and very large hospitals, the 2.0 to 2.7x ratio within peer groups is the cleaner signal.
After adjusting for case mix index (so a hospital treating sicker, more complex patients is not penalized for higher per-discharge costs), the variance narrows but persists. CMI-adjusted P75/P25 ratios: 3.1x for medium hospitals, 2.4x for large, 2.1x for very large.
A methodological note on the CMI adjustment: approximately 60% of hospitals in the HCRIS data report a CMI of 1.0, which likely reflects unreported data rather than a true case mix index of exactly 1.0. The CMI-adjusted ratios above are most reliable for medium, large, and very large hospitals, where reporting completeness is higher; for small hospitals, where CMI data is sparsest, the unadjusted bed-size peer comparison is the stronger measure.
These hospitals treat similar patients, operate at similar scale, and navigate the same payer landscape. Yet the 75th-percentile medium hospital spends $1,362 per CMI-adjusted discharge on administration while the 25th-percentile hospital spends $447. That is a $915 gap per discharge, multiplied across the 52.7 million discharges in that peer group alone.
What Doesn't Explain It
The default explanation for high US administrative costs is multi-payer complexity. The United States has roughly 900 insurance plan products, each with different formularies, networks, prior authorization rules, and billing codes. A physician practice in Ontario submits claims to one entity using one fee schedule. A physician practice in Ohio submits claims to hundreds of payers, each with its own workflow. The additional overhead is real and documented. Morra and colleagues found that US physician practices spend $82,975 per physician per year interacting with payers, 3.7 times the Canadian equivalent of $22,205 (Health Affairs, 2011).
If payer complexity were the primary driver of hospital administrative costs, hospitals with a higher share of commercial (non-government) payers should have higher administrative costs per discharge. We tested this directly.
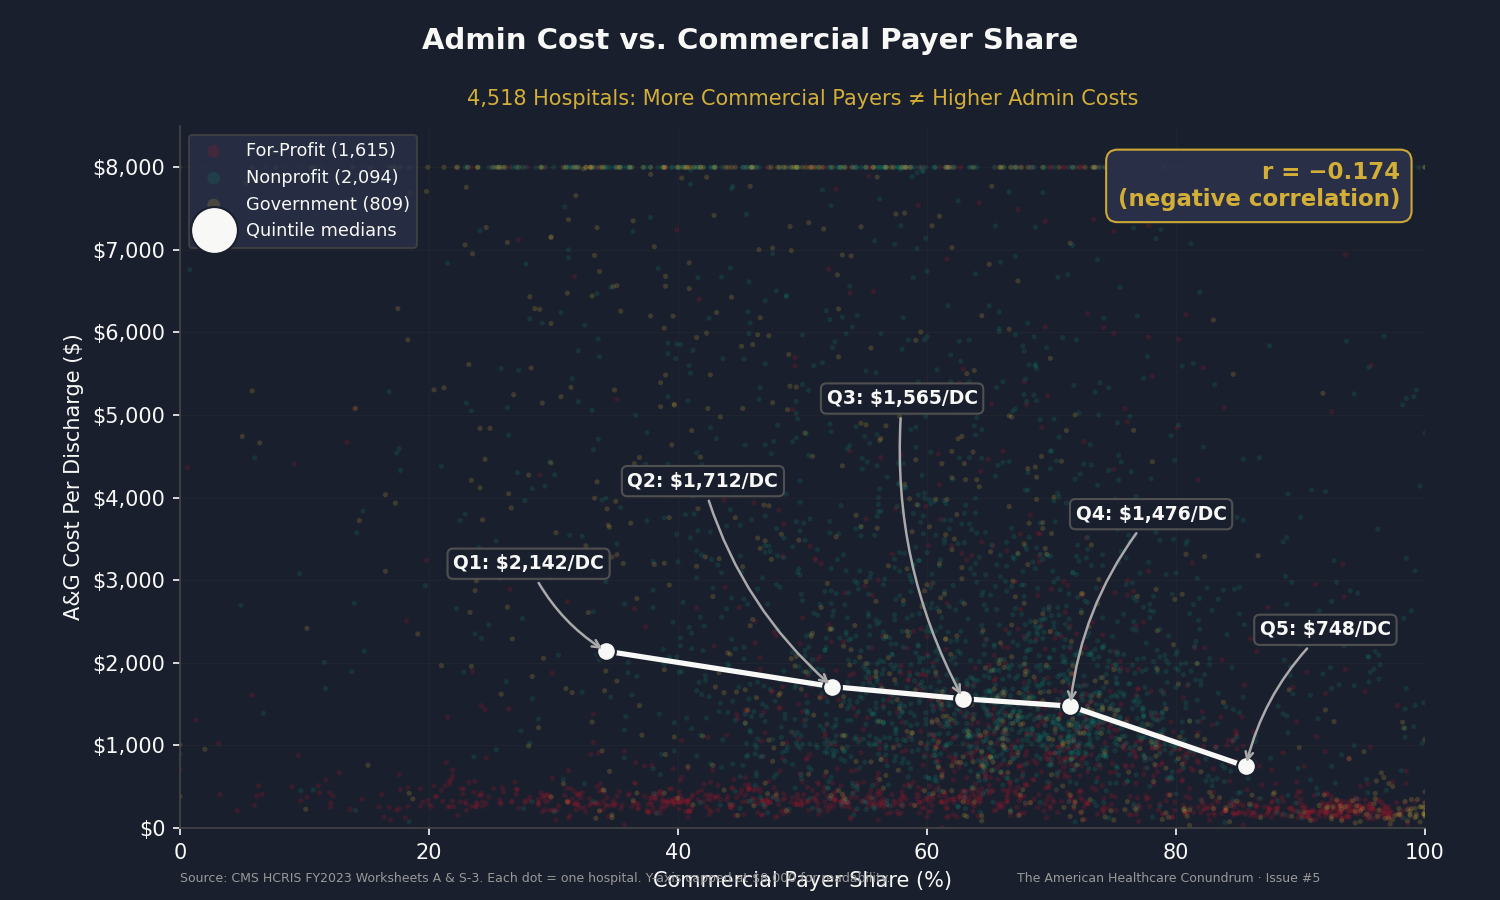
We divided the 4,518 hospitals into quintiles by commercial payer share (commercial discharges as a fraction of total discharges) and computed median A&G cost per discharge for each quintile.
| Quintile | Median Commercial Share | Median Admin/Discharge |
|---|---|---|
| Q1 (lowest commercial) | 34.1% | $2,112 |
| Q2 | 52.4% | $1,690 |
| Q3 | 62.9% | $1,550 |
| Q4 | 71.5% | $1,476 |
| Q5 (highest commercial) | 85.5% | $754 |
The correlation between commercial payer share and admin cost per discharge is negative: r = -0.174. Hospitals with more commercial payers have lower administrative costs per discharge, not higher.
This does not mean payer complexity is irrelevant. It means that at the hospital level, another variable dominates: scale. Hospitals with high commercial payer shares tend to be high-volume urban facilities that spread fixed administrative costs across many discharges. Hospitals with low commercial shares tend to be smaller, rural, and government-run, with high fixed overhead divided by fewer patients.
The implication is important for policy. Payer simplification (standardized billing, all-payer rate schedules) addresses the external complexity hospitals must navigate. But a substantial portion of the variance in hospital administrative spending is driven by internal operational factors: how hospitals organize their finance departments, whether they share administrative services, how much they spend on executive compensation, and whether they achieve economies of scale in back-office functions.
Both layers of waste are real. Both are addressable. They require different fixes.
Fifty States, Fifty Different Answers
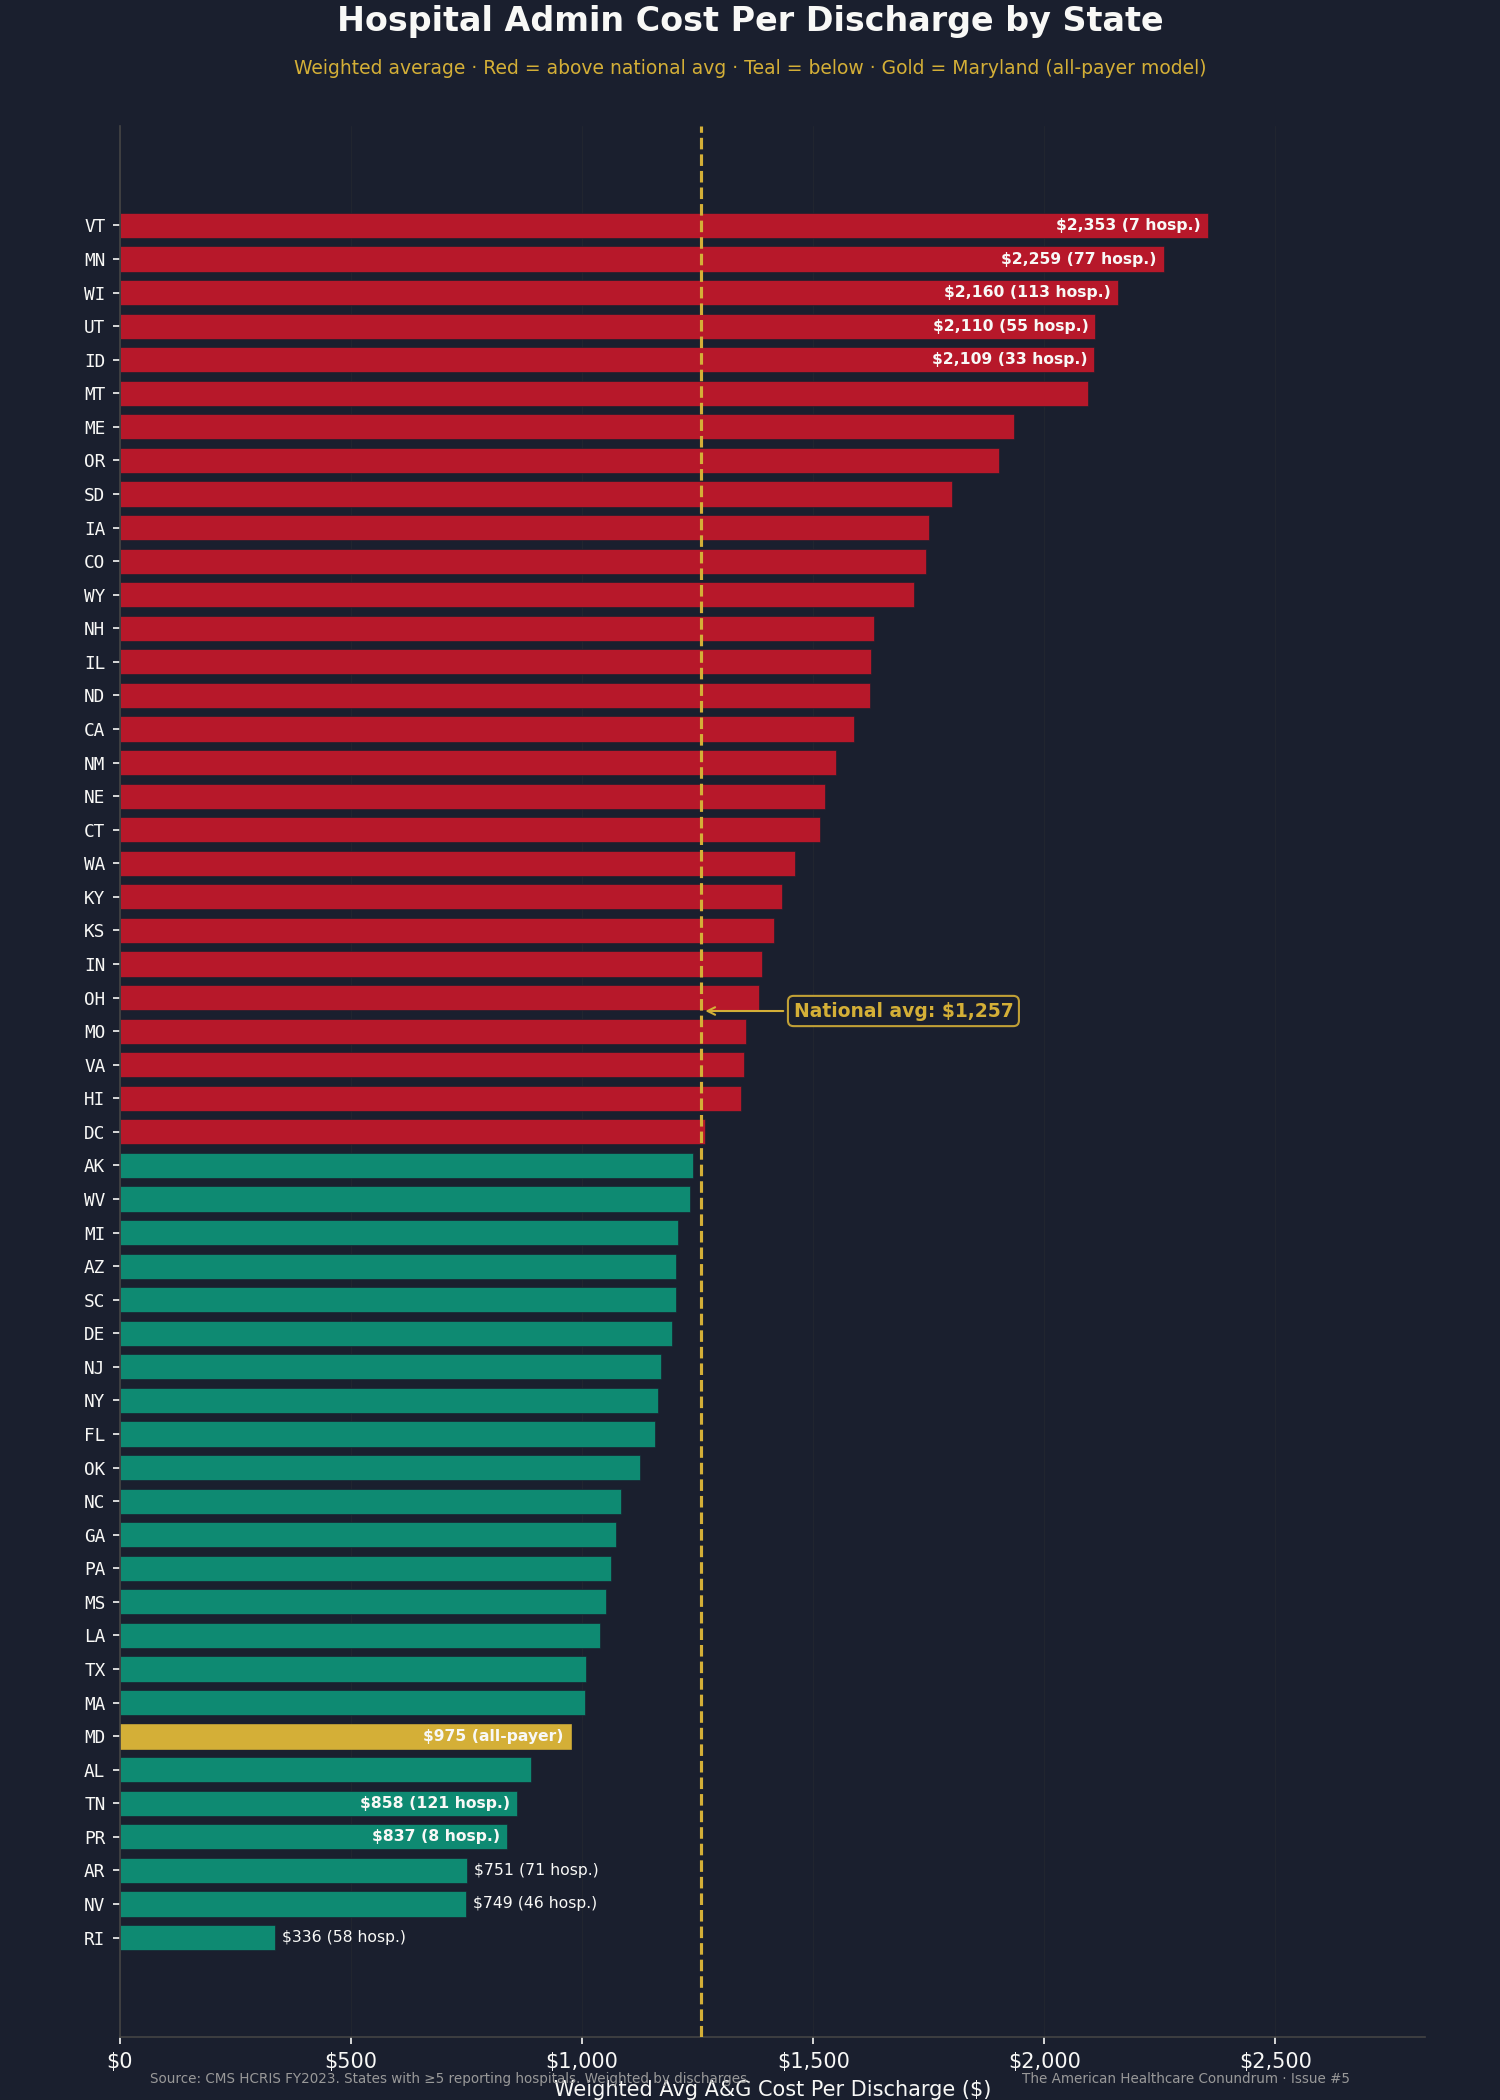
The state-level data makes the variance concrete and politically actionable. We computed weighted average A&G cost per discharge for every state with at least five reporting hospitals.
The five highest-cost states: Vermont ($2,353 per discharge), Minnesota ($2,259), Wisconsin ($2,160), Utah ($2,110), and Idaho ($2,109).
The five lowest-cost states: Rhode Island ($336), Nevada ($749), Arkansas ($751), Tennessee ($858), and Alabama ($889).
Vermont hospitals spend 2.7 times as much per discharge on administration as Tennessee hospitals. Some of this reflects hospital mix (Vermont has smaller hospitals, which carry higher fixed costs per discharge). Some reflects regional wage differences. But even after accounting for these factors, the spread is wider than any clinical justification would explain.
Maryland, which has operated an all-payer hospital rate-setting model for more than four decades (one rate schedule for all payers, one billing workflow instead of fifteen), comes in at $975 per discharge, below the national average of $1,257. This is consistent with the hypothesis that administrative simplification reduces hospital overhead, though Maryland's unique structure makes it an imperfect comparison.
The full 50-state table and the underlying hospital-level data are published in the open-source repository. Any researcher, state health department, or legislative analyst can download the CSV, filter to their state, and compute their own benchmarks.
Who Owns the Overhead
Ownership type reveals a pattern that requires careful interpretation.
For-profit hospitals report a median of $458 per discharge on A&G. Nonprofits: $1,980. Government hospitals: $2,524. The nonprofit-to-for-profit ratio is 4.3 to 1 ($1,980/$458).
Before drawing conclusions, three caveats are necessary.
First, for-profit hospitals organized under corporate parent structures (HCA, Tenet, Community Health Systems) may allocate some administrative costs to the parent company rather than to the individual hospital cost report. An HCA hospital's A&G line may not capture the corporate overhead that supports it. This would understate for-profit per-facility spending.
Second, the for-profit hospital mix skews toward specialty surgical centers and high-volume facilities that generate more discharges per bed, diluting the per-discharge cost of fixed overhead. When controlling for bed size, the gap narrows: among large hospitals (300-499 beds), for-profit median is $898 per discharge versus nonprofit $1,337 (a 1.5x ratio, not 4.3x).
Third, A&G as a percentage of total hospital costs tells a different story than the per-discharge figure. For-profit small hospitals spend 21.0% of total costs on A&G; nonprofit small hospitals spend 18.5%. For-profits spend less in absolute terms per discharge but a larger share of their (smaller) total budget on administration.
What the ownership data does establish is that the range is wide enough to imply variation in administrative efficiency. The most informative comparison is within ownership types: nonprofit medium hospitals show a P75/P25 ratio of 1.9x, meaning the most administratively expensive nonprofit hospitals spend nearly twice as much on A&G per discharge as the most efficient nonprofits of the same size. That gap, within the same ownership model and the same size class, is the clearest signal of addressable waste.
Thirty-Nine Prior Authorizations a Week
The HCRIS data measures what hospitals spend on running themselves. A separate, overlapping cost is what the system imposes from outside: the compliance burden of navigating payer requirements.
The American Medical Association surveys physicians annually on prior authorization. The 2024 survey (1,000 physicians, nationally representative) found that the average physician now completes 39 prior authorization requests per week. These are requests submitted to insurance companies asking for permission to provide care that the physician has judged medically necessary. The 39 requests consume an average of 13 hours of combined physician and staff time per week, roughly the equivalent of one full clinical workday every week on paperwork rather than patients. Thirty-five percent of physicians have hired staff whose sole function is prior authorization (not scheduling, not billing, prior authorization exclusively).
We computed the national cost of that burden using two independent methods.
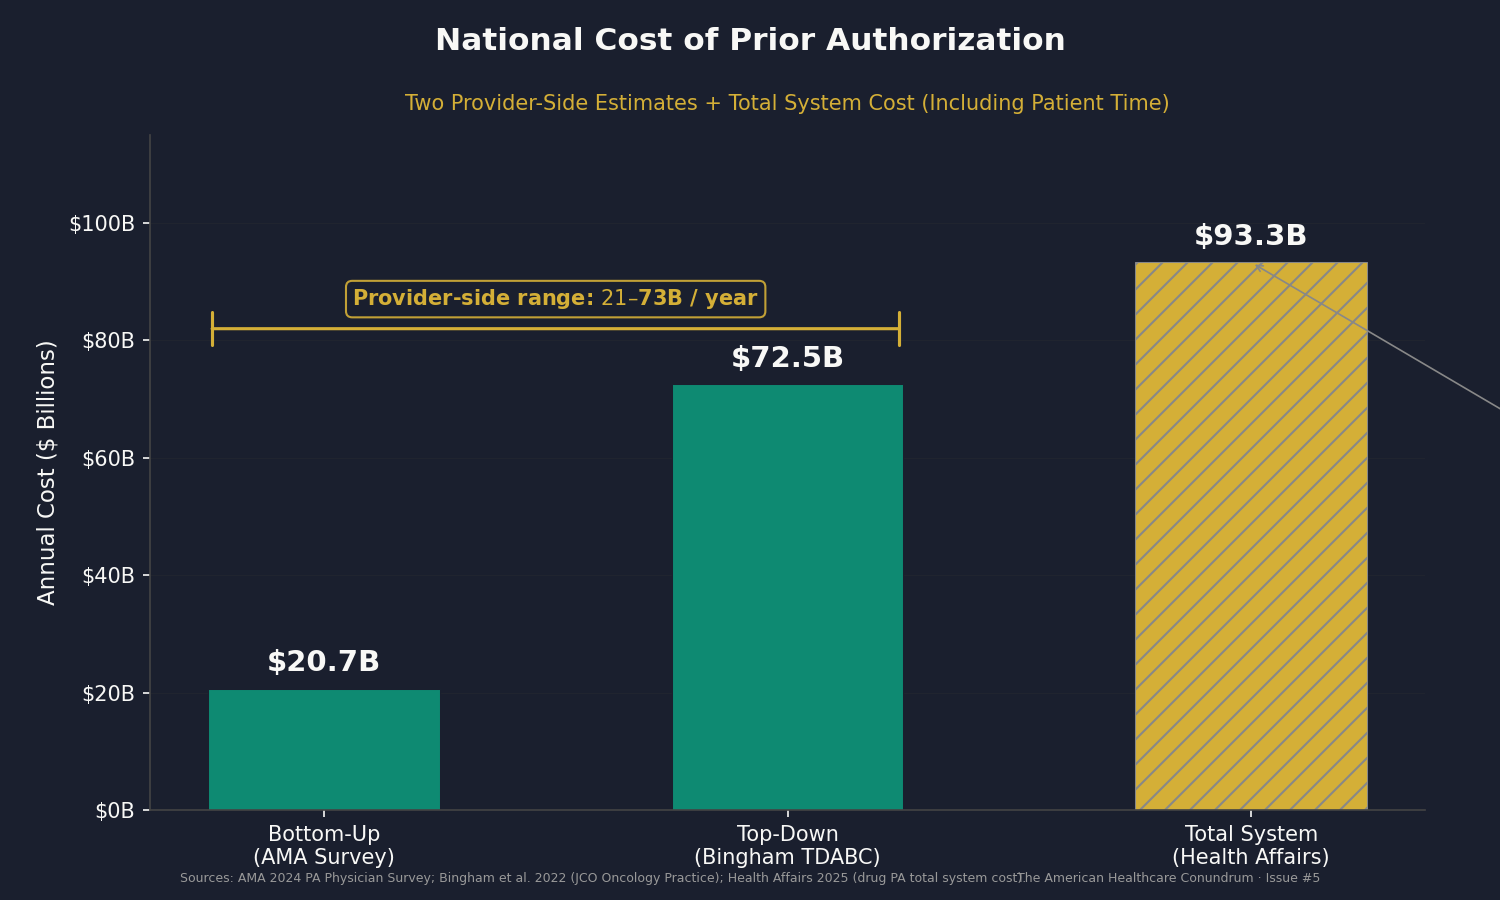
Bottom-up (AMA survey methodology): The 13 hours of combined weekly time breaks into approximately two physician hours (at a loaded cost of $185 per hour) and eleven staff hours (at $32 per hour including benefits); that is $34,656 per physician practice annually. Applied to the 70% of 851,282 direct-patient-care physicians most exposed to prior authorization requirements, the national provider-side cost is $20.7 billion per year.
Top-down (Bingham TDABC methodology): Bingham et al.'s 2022 time-driven activity-based costing study of radiation oncology prior authorization found a cost of $28 to $101 per PA event, with a midpoint of approximately $65. Applied to an estimated 1.12 billion annual PA events nationally, the top-down estimate is $72.5 billion per year.
The range is $21 to $73 billion annually, entirely on the provider side. A separate Health Affairs analysis estimated the total burden of drug prior authorization alone (including payer-side adjudication, manufacturer compliance, and patient time) at $93.3 billion annually.
One methodological note on the upper end: Bingham's $65 midpoint is derived from academic radiation oncology, a specialty with unusually complex PA requirements. Applied to all encounters, it likely overstates the average event cost. The bottom-up estimate is more conservative. Both are presented because they bound the plausible range.
The Revenue Cycle Management Industry
A physician practice in Ohio submitting claims to hundreds of payers is not accepting 15 variations on a standard process; it is operating 15 parallel administrative workflows simultaneously. The quantitative evidence for this is direct: Morra and colleagues found that US physician practices spend $82,975 per physician per year interacting with payers, 3.7 times the Canadian equivalent (Health Affairs, 2011).
The revenue cycle management industry exists to sell navigation services for this complexity. The RCM market (software, outsourced coding, prior authorization automation, denial management, payment accuracy tools) is estimated at $55 to $172 billion annually in 2024 (Grand View Research 2024, KLAS Research 2024). Every dollar of it exists because the administrative system is complex enough that providers need specialized help navigating it.
Two Layers of Waste
This issue identifies two distinct sources of administrative excess. They overlap but require different fixes.
Layer 1: System-imposed complexity. The US multi-payer architecture imposes external compliance costs on every provider. Prior authorization alone costs providers $21 to $73 billion per year. The RCM industry ($55 to $172 billion) exists exclusively to navigate payer requirements. Woolhandler and Himmelstein documented that the US spends 34.2% of NHE on administration versus Canada's 17.0%. Updated to 2023 NHE ($4.867 trillion), that baseline produces a range of $1.13 to $1.66 trillion in total US healthcare administrative spending. Even using the most conservative cross-validation (CMS narrow definition plus Center for American Progress billing-related costs), the floor is $906 billion.
Gaffney, Himmelstein, Woolhandler, and Kahn (2023, International Journal of Social Determinants of Health and Health Services) modeled hospital expenditures under global budgeting and single-payer financing and estimated $198 billion per year in hospital administrative savings. That is the structural maximum. Lavoie-Gagne et al. (2025, Arthroscopy) estimated that AI-powered administrative tools could reduce costs by $168 billion within the current architecture. The $200 billion booked for this issue sits between those benchmarks, representing achievable savings from standardized billing, automated prior authorization, and all-payer simplification, without requiring single-payer restructuring.
Layer 2: Hospital operational variance. The HCRIS data shows that hospitals of the same size, treating patients of similar acuity, under the same payer landscape, vary by 2.0 to 2.7x in administrative spending per discharge (CMI-adjusted: 2.1 to 3.1x). This is not explained by payer complexity (the correlation runs the wrong direction). It reflects differences in how hospitals organize their back offices, whether they share administrative services, and how efficiently they convert overhead into clinical support.
The savings from closing the operational gap: $18.0 billion per year if every top-quartile hospital (within its peer group) came down to the 75th percentile. $39.8 billion per year if every above-median hospital came down to peer median. These are recoverable without any change to the payer system.
The two layers are additive, not overlapping. Layer 1 measures what the system imposes. Layer 2 measures how hospitals respond to it.
Who Profits
The companies whose entire business model depends on the complexity documented in this issue are not insurance companies. They are the service layer that grew up specifically to help providers navigate what the multi-payer system requires.
Who Profits: Optum / Change Healthcare (UnitedHealth Group) FY2024 Optum Revenue: ~$236B (health services arm of UHN) | UHN CEO Comp (Andrew Witty): $26.3M | Stock Buybacks (2020-24): ~$33B This issue's mechanism: Change Healthcare, acquired by Optum/UHN in 2022 for $13 billion, processes approximately 15 billion US healthcare transactions annually (roughly one-third of all medical claims). Its product portfolio includes clearinghouse services, claims routing, prior authorization processing, electronic remittance, and payment accuracy tools. Its revenue depends on continued complexity: if claims submission were standardized to a single federal format across all payers, the clearinghouse function would be largely unnecessary. UHN, which insures more Americans than any other company, simultaneously owns the infrastructure through which those Americans' claims are processed. The February 2024 ransomware attack (and the $2 billion federal emergency response it required) illustrated the systemic risk of that concentration.
Who Profits: Waystar (NASDAQ: WAY) FY2023 Revenue: ~$797M | IPO: June 2024 (~$4.4B valuation) | CEO: Matt Hawkins This issue's mechanism: Waystar provides cloud-based revenue cycle technology including claim submission, prior authorization management, denial management, and payment accuracy software. The company processes more than 4.5 billion transactions annually. Waystar's business model depends on continued administrative complexity: as payer requirements grow, prior authorization volume expands, and claim denial rates increase, demand for Waystar's technology grows with them.
Who Profits: R1 RCM FY2023 Revenue: ~$2.3B | Taken private by TowerBrook Capital / TCP Holdings, 2024 (~$8.9B deal) This issue's mechanism: R1 RCM provides end-to-end revenue cycle management: billing, coding, prior authorization, and collections (delivered to health systems on an outsourced basis). The company's market value reflects the cost of the problem it solves: health systems pay R1 billions per year because navigating payer requirements is too complex to manage efficiently in-house. Private equity's $8.9 billion acquisition valuation in 2024 is a bet that this complexity will persist.
Other notable RCM companies: nThrive (est. $400-500M revenue, private, backed by Clearlake Capital), Ensemble Health Partners, and GeBBS Healthcare Solutions. The industry's combined revenue is a direct measure of the administrative complexity documented in this issue.
Sources: UnitedHealth Group 10-K and Optum business segment filings, FY2024 (SEC EDGAR); Waystar S-1 and 10-K filings, FY2023 (SEC EDGAR); R1 RCM 10-K (SEC EDGAR, prior to privatization); American Hospital Association, "Change Healthcare Cyberattack Impact Survey," March 2024; Senate Finance Committee, "Hearing on the Change Healthcare Cyberattack and UnitedHealth Group's Response," May 2024; CMS accelerated payment announcement, March 2024.
The Fix
The two-layer diagnosis maps to a two-track fix.
Track 1: Reduce the external complexity.
The CMS Interoperability and Prior Authorization Final Rule (CMS-0057-F) took effect January 1, 2026. Medicare Advantage, Medicaid managed care, and CHIP plans must now issue PA decisions within 72 hours (expedited) or 7 calendar days (standard), provide specific denial reasons, and report PA metrics publicly. CMS estimated $15 billion in annual savings from this rule alone. Its biggest gap: it excludes commercial insurance, where the majority of PA volume occurs.
Beyond PA, HIPAA already gives CMS authority to mandate uniform claim formats across all payers. The AHA estimates standardization saves hospitals $7 to $9 per claim. At 5 billion annual hospital claims: $35 to $45 billion in savings.
Maryland's All-Payer Model has set uniform hospital rates for all payers for more than four decades. One rate schedule means one billing workflow instead of fifteen. Our HCRIS data shows Maryland's admin cost per discharge ($975) is below the national average ($1,257).
At the structural maximum, Gaffney et al. (2023) estimated $198 billion per year in hospital administrative savings under single-payer with global budgeting. That is the ceiling.
Track 2: Close the operational gap.
The within-peer variance in our data shows $18 to $40 billion in recoverable waste from hospitals matching the efficiency of their peers. This does not require federal legislation. It requires:
Shared administrative services. Hospital systems that consolidate billing, HR, compliance, and finance across facilities can spread fixed costs over more discharges. The data shows this already happens: very large hospitals (500+ beds) have a P75/P25 ratio of just 2.0x, versus 10.6x for small hospitals.
Administrative benchmarking. Publishing hospital-level A&G data (which this issue does) creates pressure for outliers to justify their spending. When a 200-bed hospital can see that its peer group's median A&G cost is $1,112 per discharge and it is spending $2,400, that visibility is itself a mechanism for change.
The dataset accompanying this issue is published specifically for this purpose. State health departments, hospital boards, and researchers can download the CSV, filter to their state and peer group, and compute their own benchmarks.
What's Next
Issue #5 measured the cost of building a billing system complex enough to require its own industry, and found that hospitals themselves vary enormously in how much they spend navigating it.
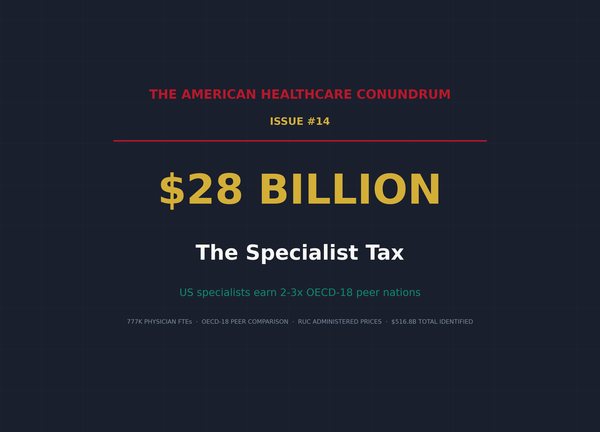
Issue #6 asks where that operational variance shows up in the physical supply chain. We analyzed per-discharge supply costs across 5,480 hospitals and found the P75/P25 ratio ranges from 2.5x to 3.4x. Combined national spending on medical supplies, implantable devices, and drugs charged to patients: $170.9 billion. Conservative savings estimate: $28 billion per year. Issue #6 is "The Supply Closet."
If you want to follow the code: github.com/rexrodeo/american-healthcare-conundrum
If you want to check our numbers: the hospital-level CSV (4,518 rows, 22 columns) is in the repository under issue_05/hospital_admin_costs_fy2023.csv.
If you want to push back on the methodology: reply to this email, or leave a comment below.
If you know someone who works in hospital operations, health IT, insurance, or healthcare policy who should read this: forward it.
Sources: CMS HCRIS HOSP10-REPORTS FY2023, Worksheet A (Administrative & General, Line 500, Column 700 and all overhead cost centers), Worksheet S-2 (CMI), Worksheet S-3 (discharges, beds, payer mix), downloads.cms.gov; author original analysis of 4,518 hospitals; Woolhandler S, Himmelstein DU, "Health Care Administrative Costs in the United States and Canada, 2017," Annals of Internal Medicine, January 2020; Gaffney AW, Himmelstein DU, Woolhandler S, Kahn JG, "Hospital Expenditures Under Global Budgeting and Single-Payer Financing: An Economic Analysis, 2021-2030," International Journal of Social Determinants of Health and Health Services, 2023; American Medical Association, "2024 AMA Prior Authorization Physician Survey," 2024; Bingham BS, Mailankody S, Johansson MV et al., "Time-Driven Activity-Based Costing and Clinical Benefit of Prior Authorization in Oncology," JCO Oncology Practice, September 2022; Lavoie-Gagne OZ et al., "Health Care Administrative Burdens and Potential Impact of Artificial Intelligence," Arthroscopy, 2025; Morra D, Nicholson S, Levinson W et al., "US Physician Practices Versus Canadians: Spending Nearly Four Times As Much Money Interacting With Payers," Health Affairs, August 2011; Health Affairs, "Drug Prior Authorization Costs $93.3 Billion Annually," 2025; Center for American Progress, "The Hidden Costs of Billing-Related Complexity in the US Healthcare System," 2023; CMS, "CMS Interoperability and Prior Authorization Final Rule (CMS-0057-F)," January 2024; CMS National Health Expenditure Accounts, Historical Tables, 2023 (cms.gov); Grand View Research, "Revenue Cycle Management Market," 2024; KLAS Research, "Revenue Cycle Management Trends," 2024; UnitedHealth Group 10-K FY2024 (SEC EDGAR); Waystar S-1 and 10-K FY2023 (SEC EDGAR); R1 RCM 10-K FY2023 (SEC EDGAR); American Hospital Association, "Change Healthcare Cyberattack Impact Survey," March 2024; Senate Finance Committee, "Hearing on the Change Healthcare Cyberattack and UnitedHealth Group's Response," May 2024.
Savings Tracker: $328.6 Billion and Counting
Five issues. Five distinct mechanisms generating excess spending in the US healthcare system.
- Issue #1 — OTC Drug Overspending: $0.6B/year
- Issue #2 — Drug Reference Pricing (brand-name drugs vs. international peers): $25.0B/year
- Issue #3 — Hospital Commercial Reference Pricing: $73.0B/year
- Issue #4 — PBM Reform: $30.0B/year
- Issue #5 — Administrative Waste (hospital operational variance + multi-payer billing complexity + prior authorization compliance): $200.0B/year
Running total: $328.6 billion per year, 11.0% of the $3 trillion annual gap between US and Japanese per-capita healthcare spending.
The $200 billion for Issue #5 is the conservative end of a range that extends to $600 billion or more depending on how much structural reform is implemented. It books what is achievable through meaningful but not maximal reform: standardized billing, automated prior authorization, all-payer simplification, and hospital administrative benchmarking. The higher end requires structural reforms that reduce the number of billing relationships providers must maintain. Neither end double-counts PBM extraction (Issue #4) or insurer denial strategy (a future issue), which address different layers of the system.
The American Healthcare Conundrum publishes when the data is ready. All analysis uses publicly available data. Code is open-source. Figures are validated before publication.
Get every issue in your inbox
The American Healthcare Conundrum is free. One fixable problem in U.S. healthcare, with the data, every week.